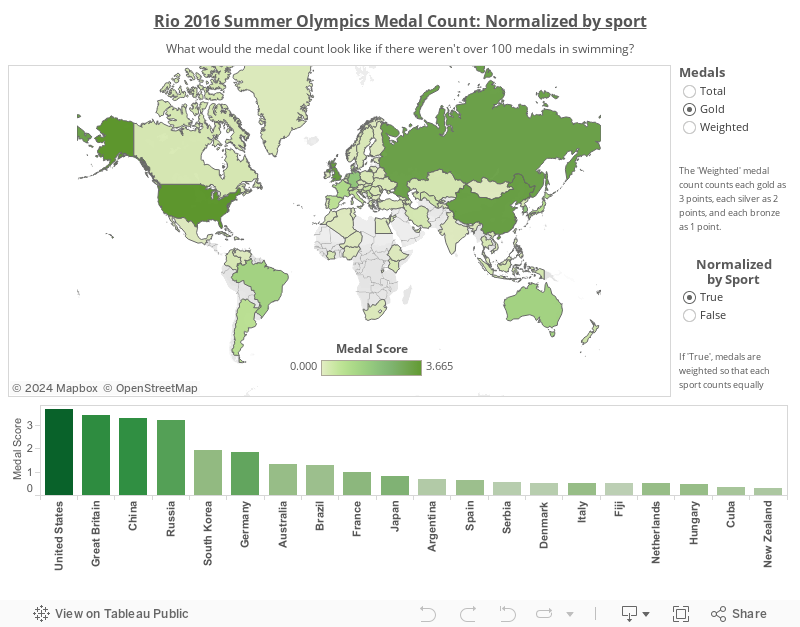
Olympics 2016: Normalizing results by sport
August 20, 2016
Python code for data acquisition and analysis
A new medal count: Normalized by sport
In our last Tableau visualization, we could vary the weights of gold, silver, and bronze medals to calculate a composite score for each country other than a simple medal count. However, I still don’t think the weighted medal count above is sufficient because it seems odd that we weight sports with many medals, like swimming, much more than sports with fewer medals, like volleyball. Therefore, in the visualization below, you can click to observe how the medal count differs if we were to normalize the results such that each sport has the same weight. For example, since there are 104 medals in swimming, each medal is worth 1/104, and since there are 12 medals in archery, they are each worth more (1/12 of a point).
Create your own Olympics: Custom sports weighting
Interestingly, if we look at the number of gold medals after applying the uniform weighting across sports, we see that the United States’s lead diminishes considerably. Additionally, I thought it’d be fun to create an interactive visualization in which we can choose the weighting for each sport and then this will weight the medal count appropriately. For example, if I’m a fan of diving (weight = 5), but I don’t like swimming as much (weight = 0.5), then I see that China wins my Olympics.