Summary
We have developed a 10-dimensional system for rating the burritos in San Diego. The goal of this project is threefold:
- Identify the best and worst burritos in San Diego to share this information with others. Check out the burrito map here
- Characterize the variance in burrito qualities across the county.
- Generate models for what makes a burrito great and investigate correlations in its dimensions
As of the most recent update of this blog post (Aug 2018), 71 reviewers visited 79 taco shops and critiqued 373 burritos. While Valentine’s Mexican Food has earned the title of highest average burrito rating, the (non data-driven) consensus, there are many more to try. Here, the average burrito costs about $7 and is about 790mL in volume. Further, we explore correlations between burrito dimensions, such as the quality of the meat and nonmeat fillings, and identify a novel correlation between tortillas and Yelp ratings.
For detailed descriptions, see the database of 350+ burrito reviews, and contribute your own reviews here. For more detailed analysis, see the codebase for this project, the burrito poster, graduate seminar slides, and Ignite talk.
Motivation
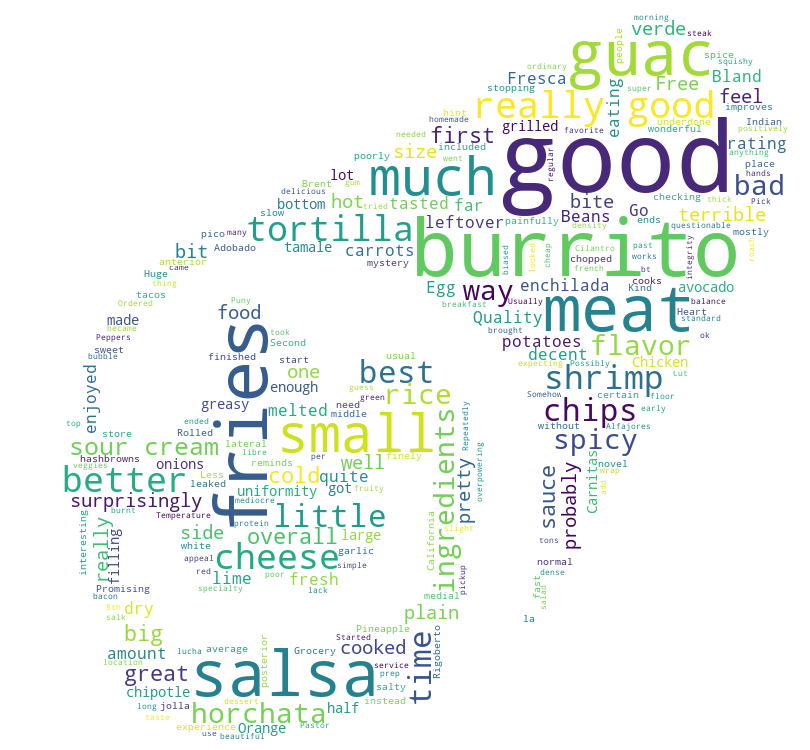
Mexican cuisine is often the best food option is southern California. And the burrito is the hallmark of delicious taco shop food: tasty, cheap, and filling. Though these “majestic cylinders” are consumed at a rate faster than one per second across San Diego county [1], they have been dramatically understudied [2]. This lack of funding to support public burrito knowledge has led millions of people to eating a burrito and subsequently feeling dissatisfied, a tragedy that can be avoided. Even the most experienced burrito eaters have experienced the following disappointments:
- “I just took a bite entirely of sour cream”
- “This carne asada has the texture of rubber”
- “THE TEMPERATURE OF THE EGGS IN THIS BURRITO IS TOO DAMN HIGH”
- “I am not looking forward to the leftover burrito in my fridge”
- “Where is the meat in this burrito?”
- “I need a fork”
For this reason, an effort was launched to critique burritos across the county and make this data open to the lay burrito consumer. Armed with an ever-growing database of over 100 burritos from Chula Vista to San Marcos (but mainly around UCSD), consumers can make better educated decisions of where to get their next fix. With this active feedback into consumption choice, we hope this will also cause burrito chefs to continuously improve their own methods. This study was predominantly a joint effort between the Neurosciences graduate program at UC San Diego and the amateur beach volleyball group that plays at Muir courts at 5pm. It is an extension of the single-dimensional burrito analysis published in 2015.
Previous work: FiveThirtyEight’s best burrito in America
Anna Maria Barry-Jester, a reporter with the website FiveThirtyEight travelled across America to identify the best burrito in the country. Their process, described here, was to data mine Yelp in order to narrow down the pool of >67,000 restaurants to just 64. Then, Anna completed a “burrito bracket” in which groups of four restaurants faced off against each other in knockout-fashion for 3 rounds until only one taqueria remained: La Taqueria in San Francisco. Their articles are worth reading, as their efforts were much more serious, qualifications much more qualified, and methods much better thought-out than my own. In addition to naming a best burrito in America, they also have interesting insight on crowdsourced reviewing systems and biases.
The 10-dimensional burrito
Contrary to popular belief, burritos do not merely exist in 3 dimensions. They transcend the physical limitations of space. From polling several San Diegans, we’ve established the 10 core dimensions of the San Diego burrito.
- Volume - “size matters,” “bigger is better,” or whatever your favorite innuendo is fits because there’s nothing more disconcerting than ordering a burrito and not being full.
- Tortilla quality
- Temperature - the Goldilocks zone
- Meat quality
- Non-meat filling quality
- Meat : filling - The ratio between meat and non-meat. Perhaps the golden ratio: 1.6180339887…
- Uniformity - Bites full of sour cream and cheese with no meat are disappointing.
- Salsa quality - and variety!
- Flavor synergy - "That magical aspect a great burrito has, making everything come together like it is a gift from the skies" - A wise Dutchman
- Wrap integrity - you ordered a burrito, not a burrito bowl.
All of these measures (except for Volume) are rated on a scale from 0 to 5, 0 being terrible, and 5 being optimal. In the future, Meat:Filling and Temperature measures may stray from this subjective scale in order to better quantify these two valuable burrito characteristics. Additionally, acquisition of a portable scale will allow collection of mass. Cost (in USD) and hunger level (on the same 0-5 scale) are measured as potential control factors. In addition to these 10 core dimensions, we also collect two summary statistics:
- Overall rating - 0 to 5 stars
- Recommendation - Yes/No. If a friend asked you about that burrito with the intent of purchasing one, would you recommend it?
Where can I get the best burrito?
This controversial question is argued by many who hold very strong opinions. However, I believe that there is no single best burrito for a few reasons:
- Each burrito at each taco stand has significant variance between each sample. Each chef has their own burrito assembly techniques and certainly cannot construct each burrito in the exact same way.
- Each person processes a given burrito in different ways, from their tongue to their higher-level cortices. Also, the optimal burrito for consumption varies across time for a single individual (e.g. a breakfast burrito may be optimal in the morning, and a carne asada burrito for dinner).
Therefore, the best we can do is to see which burritos are consistently rated the best by multiple reviewers. We want to identify the burritos that will be maximally enjoyed by the most number of people. At this time, the data-driven title for “best” burrito shop in the area is Valentine’s Mexican Food, which is about 1 mile north of the convention center. However, this is only a preliminary conclusion, as many factors were uncontrolled. Notably, a relatively high proportion of the reviewers at Valentine’s were from out of town, and so their palates may be unusually naive to burritos. Personally, my favorite California burrito is at the Taco Stand in La Jolla. The quality of their carne asada is unmatched and worth the extra cost and lack of seating. Luis, on the other hand, is a strong advocate of California Burritos in Linda Vista. Are all worth a trip.
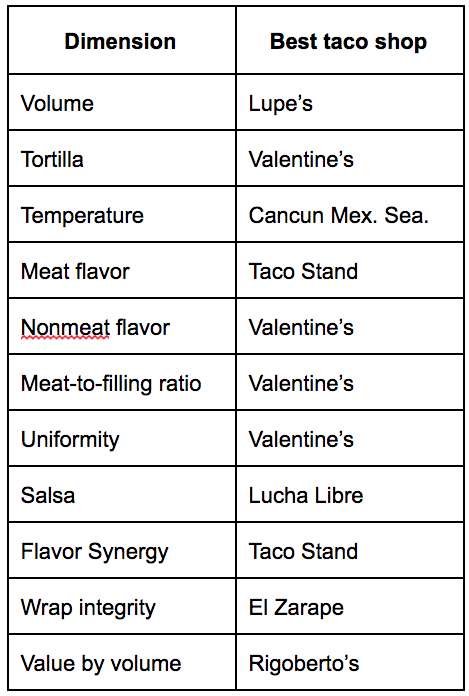
As more data is collected, we improve our confidence in not only which taco shops have the best burritos, but those with the best meat, best tortilla, and winners in the other aforementioned burrito dimensions. By limiting our analysis to those taco shops that have at least 5 burrito reviews, we have 14 taco shops, ranked in Figure 1. Subsequently, Table 1 shows the best taco shop in each burrito dimension. The heterogeneity in names here underscores how no single taco shop serves the best burrito in all dimensions, but rather each have their unique strengths.
The MNIST (Mexican National Institute for Sustenance Taste) burrito database
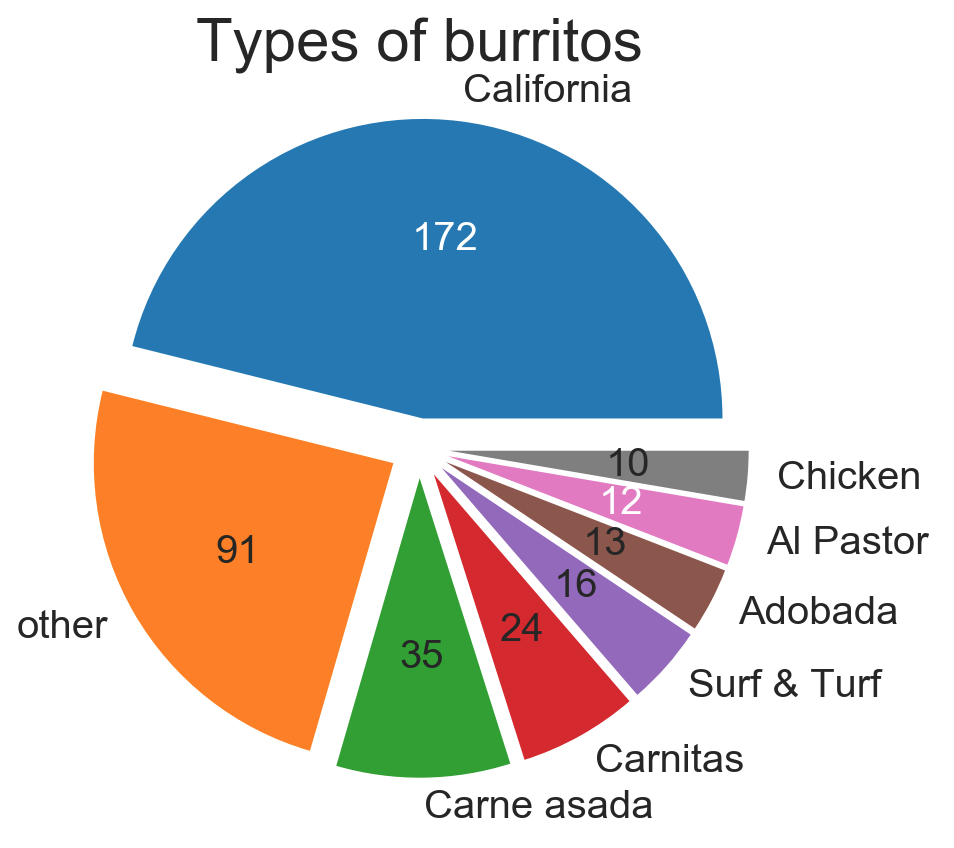
As with the MNIST handwritten digit database, this database is publicly available (Google Sheet). The first version of the database (May 2016) started with 104 burritos, but the current number of (pseudo-QC’d) ratings is now up to 373, across 79 restaurants. Notably, only a quarter (20/79) of the taco shops provided free chips. The California burrito was the most commonly rated variety, mainly because it is one of my favorites and a standard in San Diego. However, multiple samples were taken from other common varieties as well as each restaurant’s specialties.
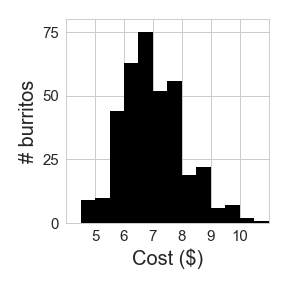
While burritos are known to be inexpensive, there is significant variance across taco shops. The average burrito was about $7 before tax, but this value ranged from $5 to $10.
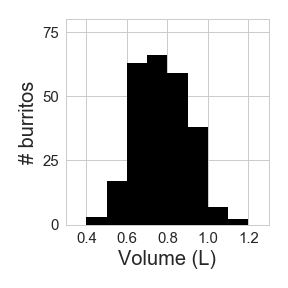
Volume was estimated using a flexible tape measure (Wal-Mart, sewing section) trimmed to a length of 30cm for better portability. First, before any part of the burrito was consumed, the tape measure was extended in front of the burrito, and the length of the burrito-proper (portion of the burrito with approximately the same circumference as the center) was measured with a precision of 5mm. Second, the tape measure was wrapped around the center of the burrito to record the circumference. An estimate of burrito volume was then calculated using these two measures. The average burrito occupied approximately 0.79 liters but varied across the distribution shown below.
Linear models to predict overall burrito quality
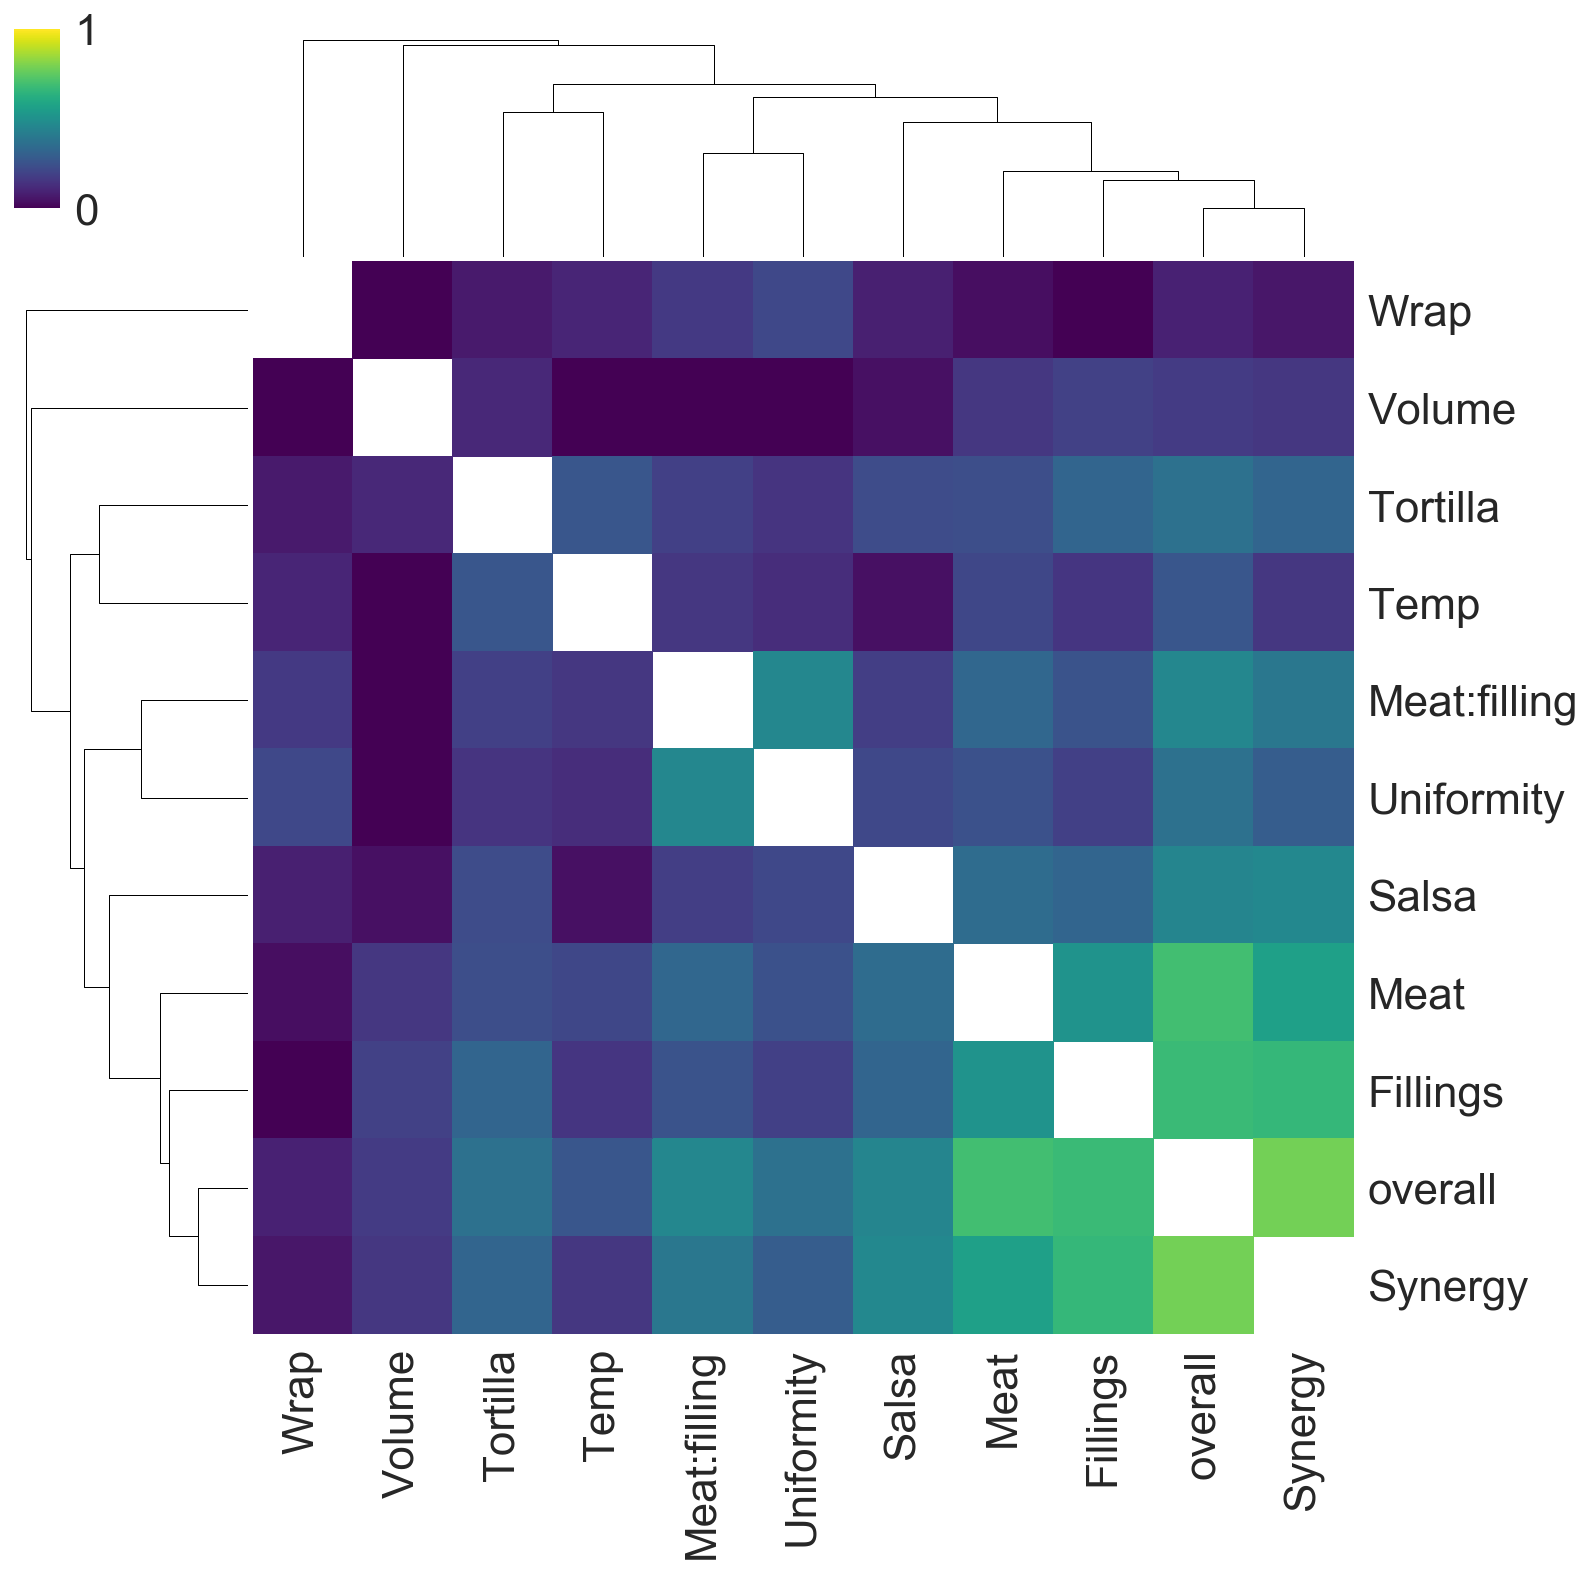
Of the above dimensions, which are the most important to the overall rating of a burrito? Before attempting to answer this, it is important to note that each metric is not independent of one another, and in fact there are considerable correlations between numerous dimensions. This is clearly seen in the correlation matrix below. While the overall rating correlates positively with almost all measures, these measures are not independent of one another, so it is difficult to disentangle how each one contributes to the overall rating. This limitation may be rooted in a few possibilities:
- Physical limitations of the human gustatory system and subsequent neural processing
- Restaurants that performs well in one burrito metric are more likely to perform well in other metrics.
- Some metrics will inherently be dependent, such as filling quality and flavor synergy.
Despite the correlations between our burrito features, a general linear model predicted overall burrito rating based on 8 of the fundamental burrito dimensions as well as Cost and Hunger Level as controlling factors. “Flavor synergy” is an ambiguous term that may be difficult to disassociate from one’s overall rating, so this was removed as a predictor. Additionally, we do not yet have sufficient data on burrito size to include it in the model. The correlation coefficients for each of the 10 predictors are plotted below. Overall, the 10 features explained 70% of the variance in overall rating.
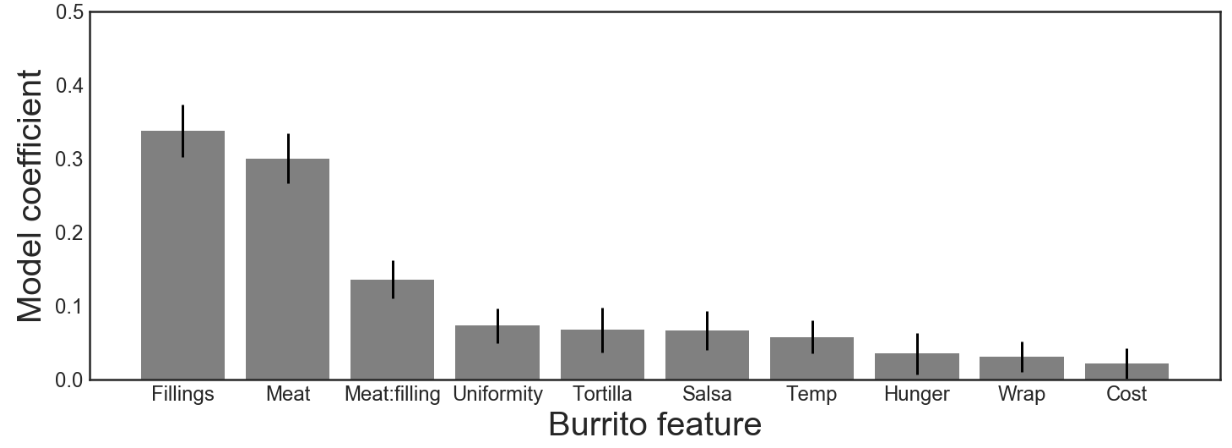
The two most significant predictors were relatively unsurprising: meat and nonmeat-filling flavor. However, what is more interesting is the relative weighting of these features. While I am known to claim that meat quality is the most important aspect of a burrito, the non-meat fillings are actually given more weight in the model. It’s also notable that the balance between these two ingredient categories is the next-most important feature, beating out other notable characteristics such as salsa quality and the tortilla flakiness.
Also interesting is what is not a reliable contributor to overall burrito rating. First, a more expensive burrito does not equate to a tastier burrito. Hunger level is not a significant predictor of overall rating, contrary to the idea that a burrito will taste better if the consumer is more hungry. This may be indicative of the quality training of these reviewers who are not fooled by their physiological state and remain as objective as possible for burrito ratings.
While the ratings for Fillings, Meat, Salsa, and Tortilla are heavily reliant on the quality of the ingredients, the other measures are more sensitive to the skilled techniques of the burrito chef. It may be counter-intuitive that the ingredient uniformity, temperature, and wrap integrity were not significant predictors of the overall rating. Naively, one could conclude from this that all that’s important in a burrito is the quality of its ingredients, not the care with which it was prepared. An alternative is that these indications of poor technique are more common at a place that uses poor ingredients. Another interpretation is that poor preparation (e.g. too low of a temperature) can have a negative impact on the subjective ratings of ingredient quality. However Meat:Filling, was a significant predictor of overall burrito rating. Therefore, when burrito artists are making their masterpieces, they should pay close attention to this balance and avoid skimping out too much on the meat.
Is there a recipe for a great burrito? A second linear model was designed to predict overall rating, this time based on the ingredients in each burrito. In order to be included in the model, an ingredient had to be in at least 10 burritos. Ten ingredients met this qualification: Beef, Pork, Pico de Gallo, Guacamole, Cheese, Potatoes, Sour cream, rice, beans, and sauce. Though these features had binary values, a linear model was a reasonable first pass for regression analysis [3]. However, the linear model only explained 12% of the variance in the overall rating, using the same number of features as the previous linear model. This was lower than 27% of models trained using the same number of features but with random values. From this, we conclude that the ingredients chosen for a burrito is not critical, it’s how the ingredients are prepared.
Future plans
We are certainly not satisfied with our sparse sampling of the burritos around San Diego county. Assembling a reliable must-try list for a burrito enthusiast will require visiting many new taco shops and increasing our sampling at the current ones. The burritosofsandiego Tumblr will help here, and perhaps we will integrate some of its data into future analysis. While doing this, we hope to continue to characterize the spectrum of burritos found across San Diego.
While the current analysis was limited to linear models, future analysis will investigate nonlinear effects across the burrito dimensions (see the <a href=”https://srcole.github.io/assets/burrito/poster.pdf”</a> and slides for updated analysis). For example, is it possible for a burrito to recover from a Meat quality rating of 1/5 to achieve an above-average overall rating? As the data set grows, nonlinear techniques and machine learning approaches can be utilized to extract more insight on the burritos across San Diego. Furthermore, case studies of specific burritos reviewed by many individuals will allow for more controlled analysis.
In writing this, I welcome and hope to receive suggestions on data collection improvements and analytics ideas. Additionally, by opening up this data set, I encourage anyone who is interested to perform their own analysis and share their conclusions! Most importantly, I hope that readers will contribute to this data set by filling out this form.
Acknowledgements
Thank you to everyone who rated a burrito and provided feedback to improve this system. I am especially grateful to the multiple-burrito raters including Sage Aronson (14 burritos), Ricardo Serrano (18 burritos), and Emily Cheng (58 burritos). And thank you to the National Science Foundation Graduate Research Fellowship program for providing a stipend with sufficient disposable income to eat a lot of burritos.
Footnotes
[1] Estimate 3.2 million people in San Diego county eat an average of 1 burrito per month.
[2] A Google Scholar search for “california burrito” yields 15 results, all of which are not accessible or irrelevant.
[3] http://stats.stackexchange.com/questions/30820/how-do-you-predict-a-continuous-value-from-many-booleans-a-continuous-value . I may look at other options in the future.