Historical analysis of FIRE strategies
September 01, 2024
In the financial independence subreddit, r/FIRE, it’s common for users to ask “Is $X enough to retire?”. I analyzed some historical inflation and SPY return data to get a sense of how often different retirement strategies succeed.
- The retiree sets a withdrawal rate tha they want to live on (e.g. 4%, $40k if initial investment is $1M).
- The withdrawal amount each year is increased based on inflation.
- The retiree has all funds invested in SPY, which would not be the case for conservative investors.
- Data used was obtained from officialdata.org and can be found in this sheet.
- Google Colab notebook with python code of simulation and visualization
- A friend pointed me to Engaging Data, which has a much nicer FIRE calculator.
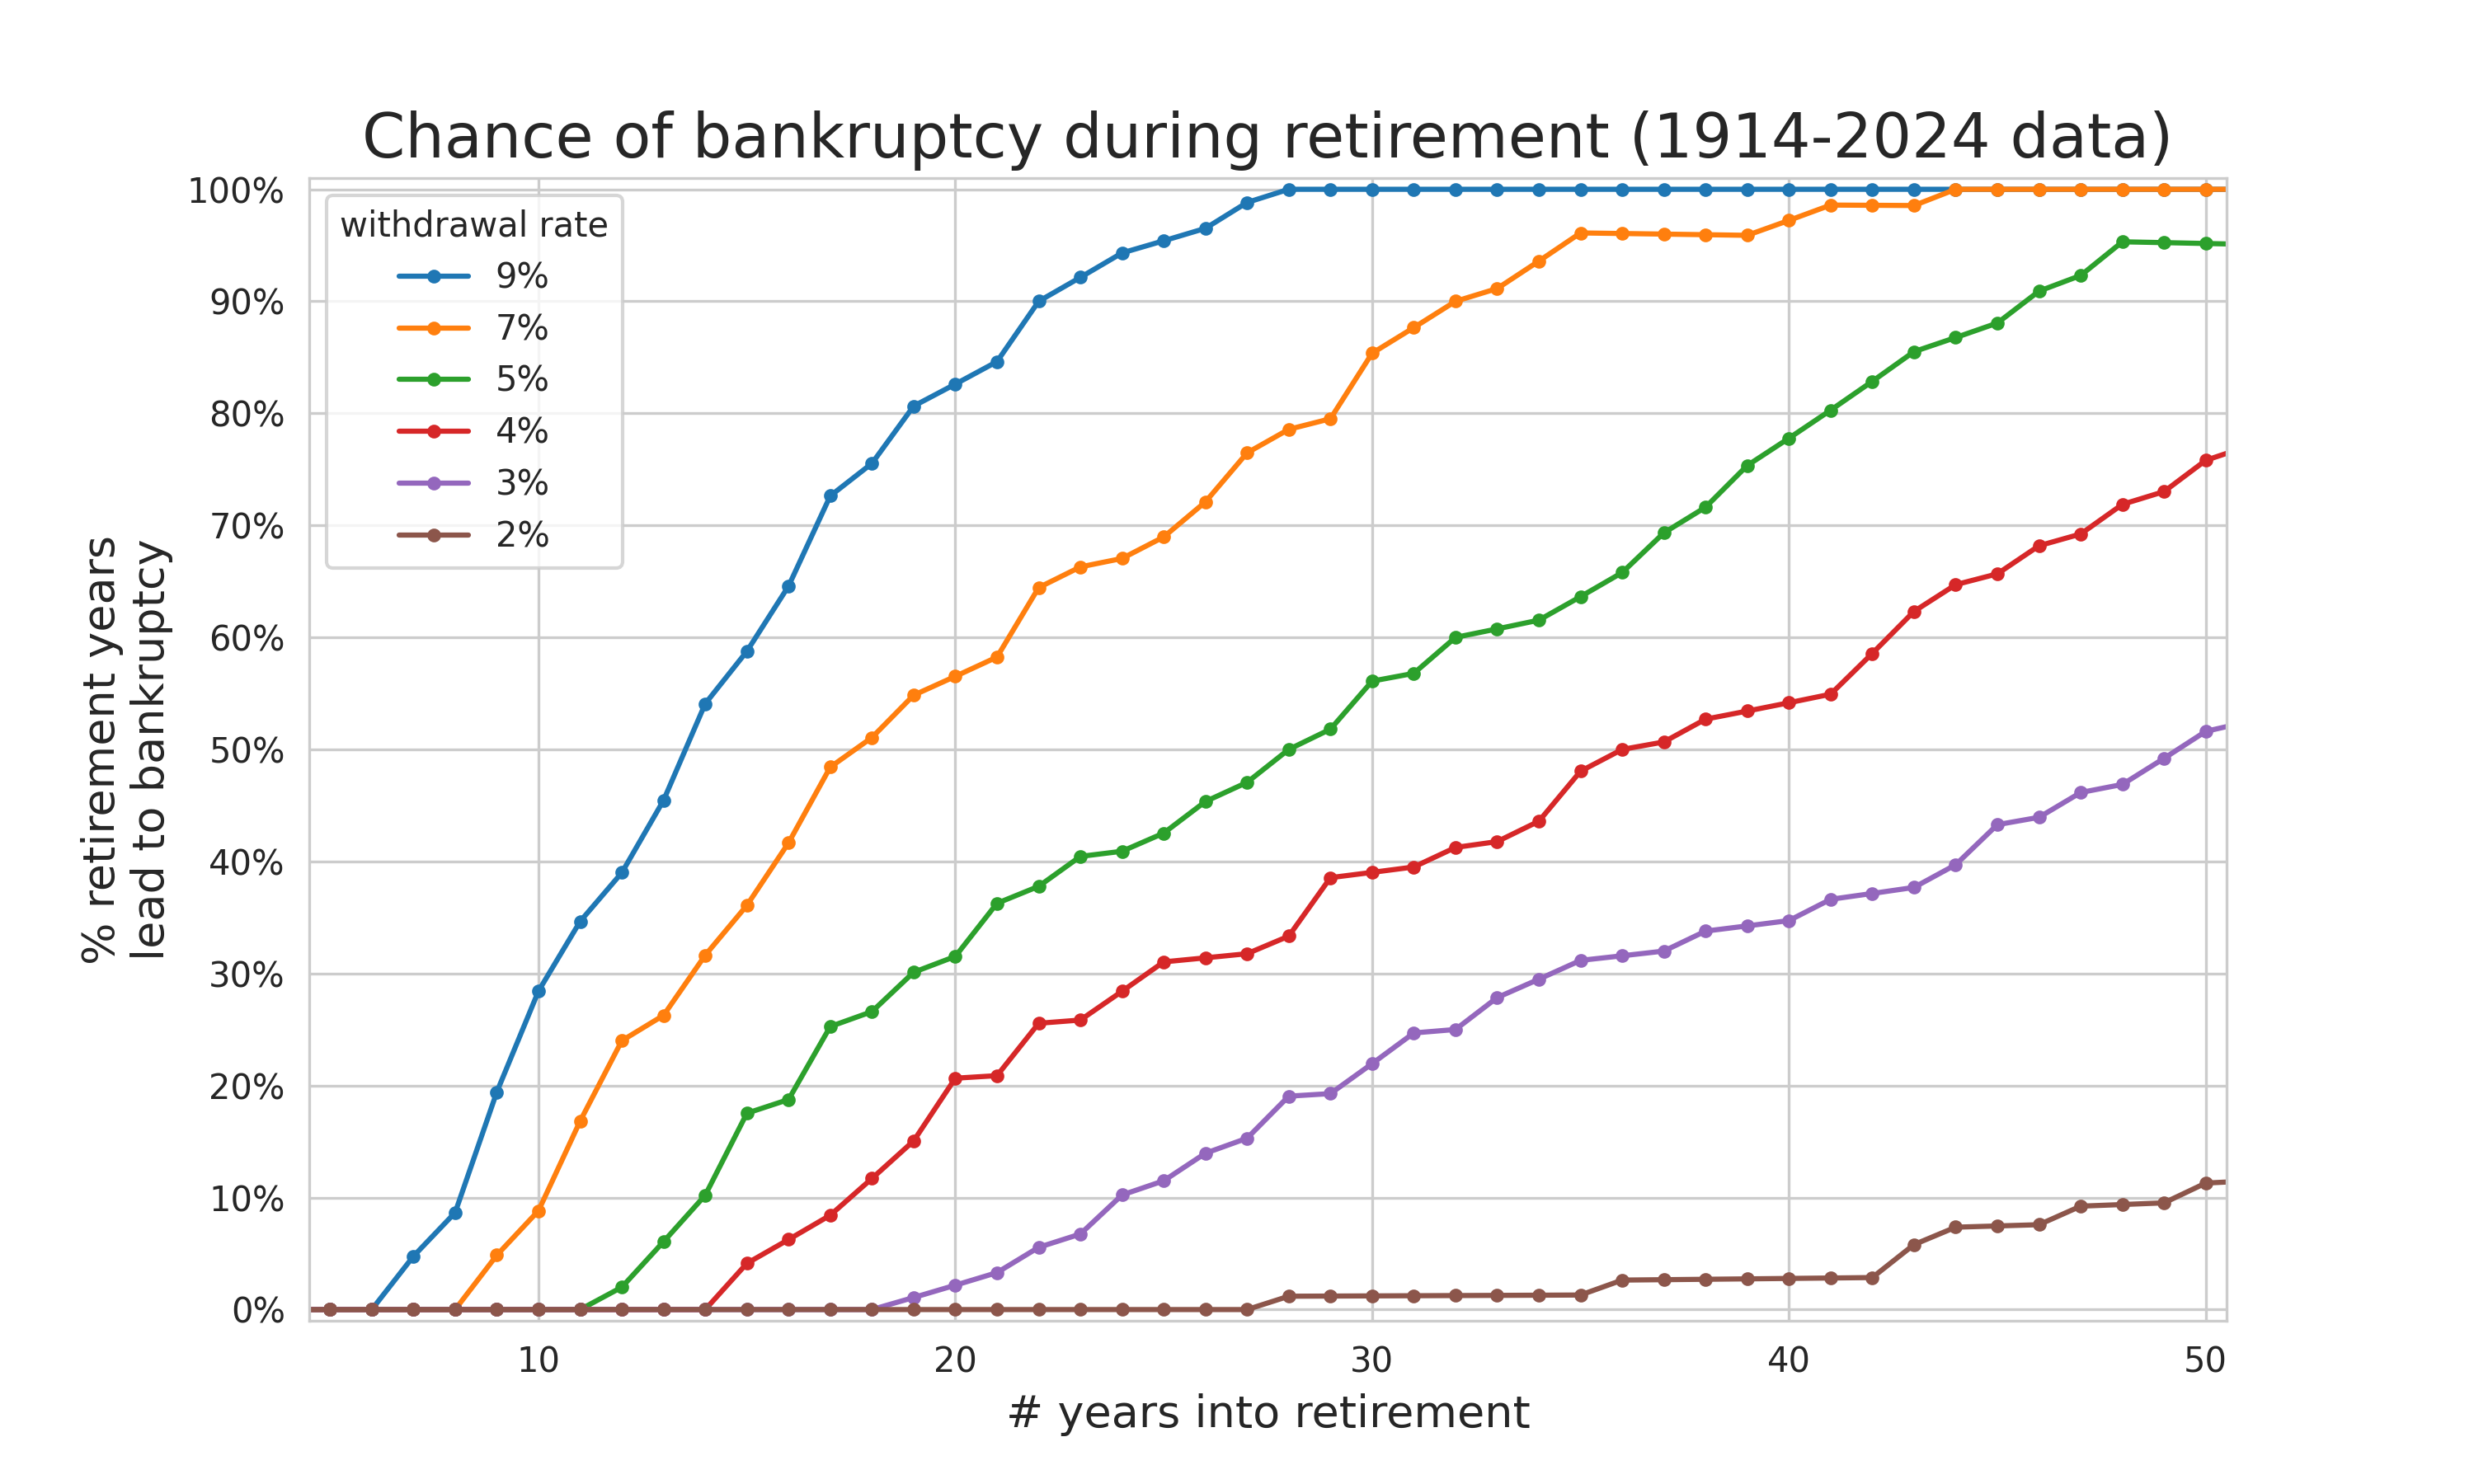
Figure 1. What is the chance of going backrupt after X years of retirement if a budget is set based on an initial withdrawal rate? By simulating retirement in each year, this plot summarized in what % of those retirements, you would have gone bankrupt after X years.
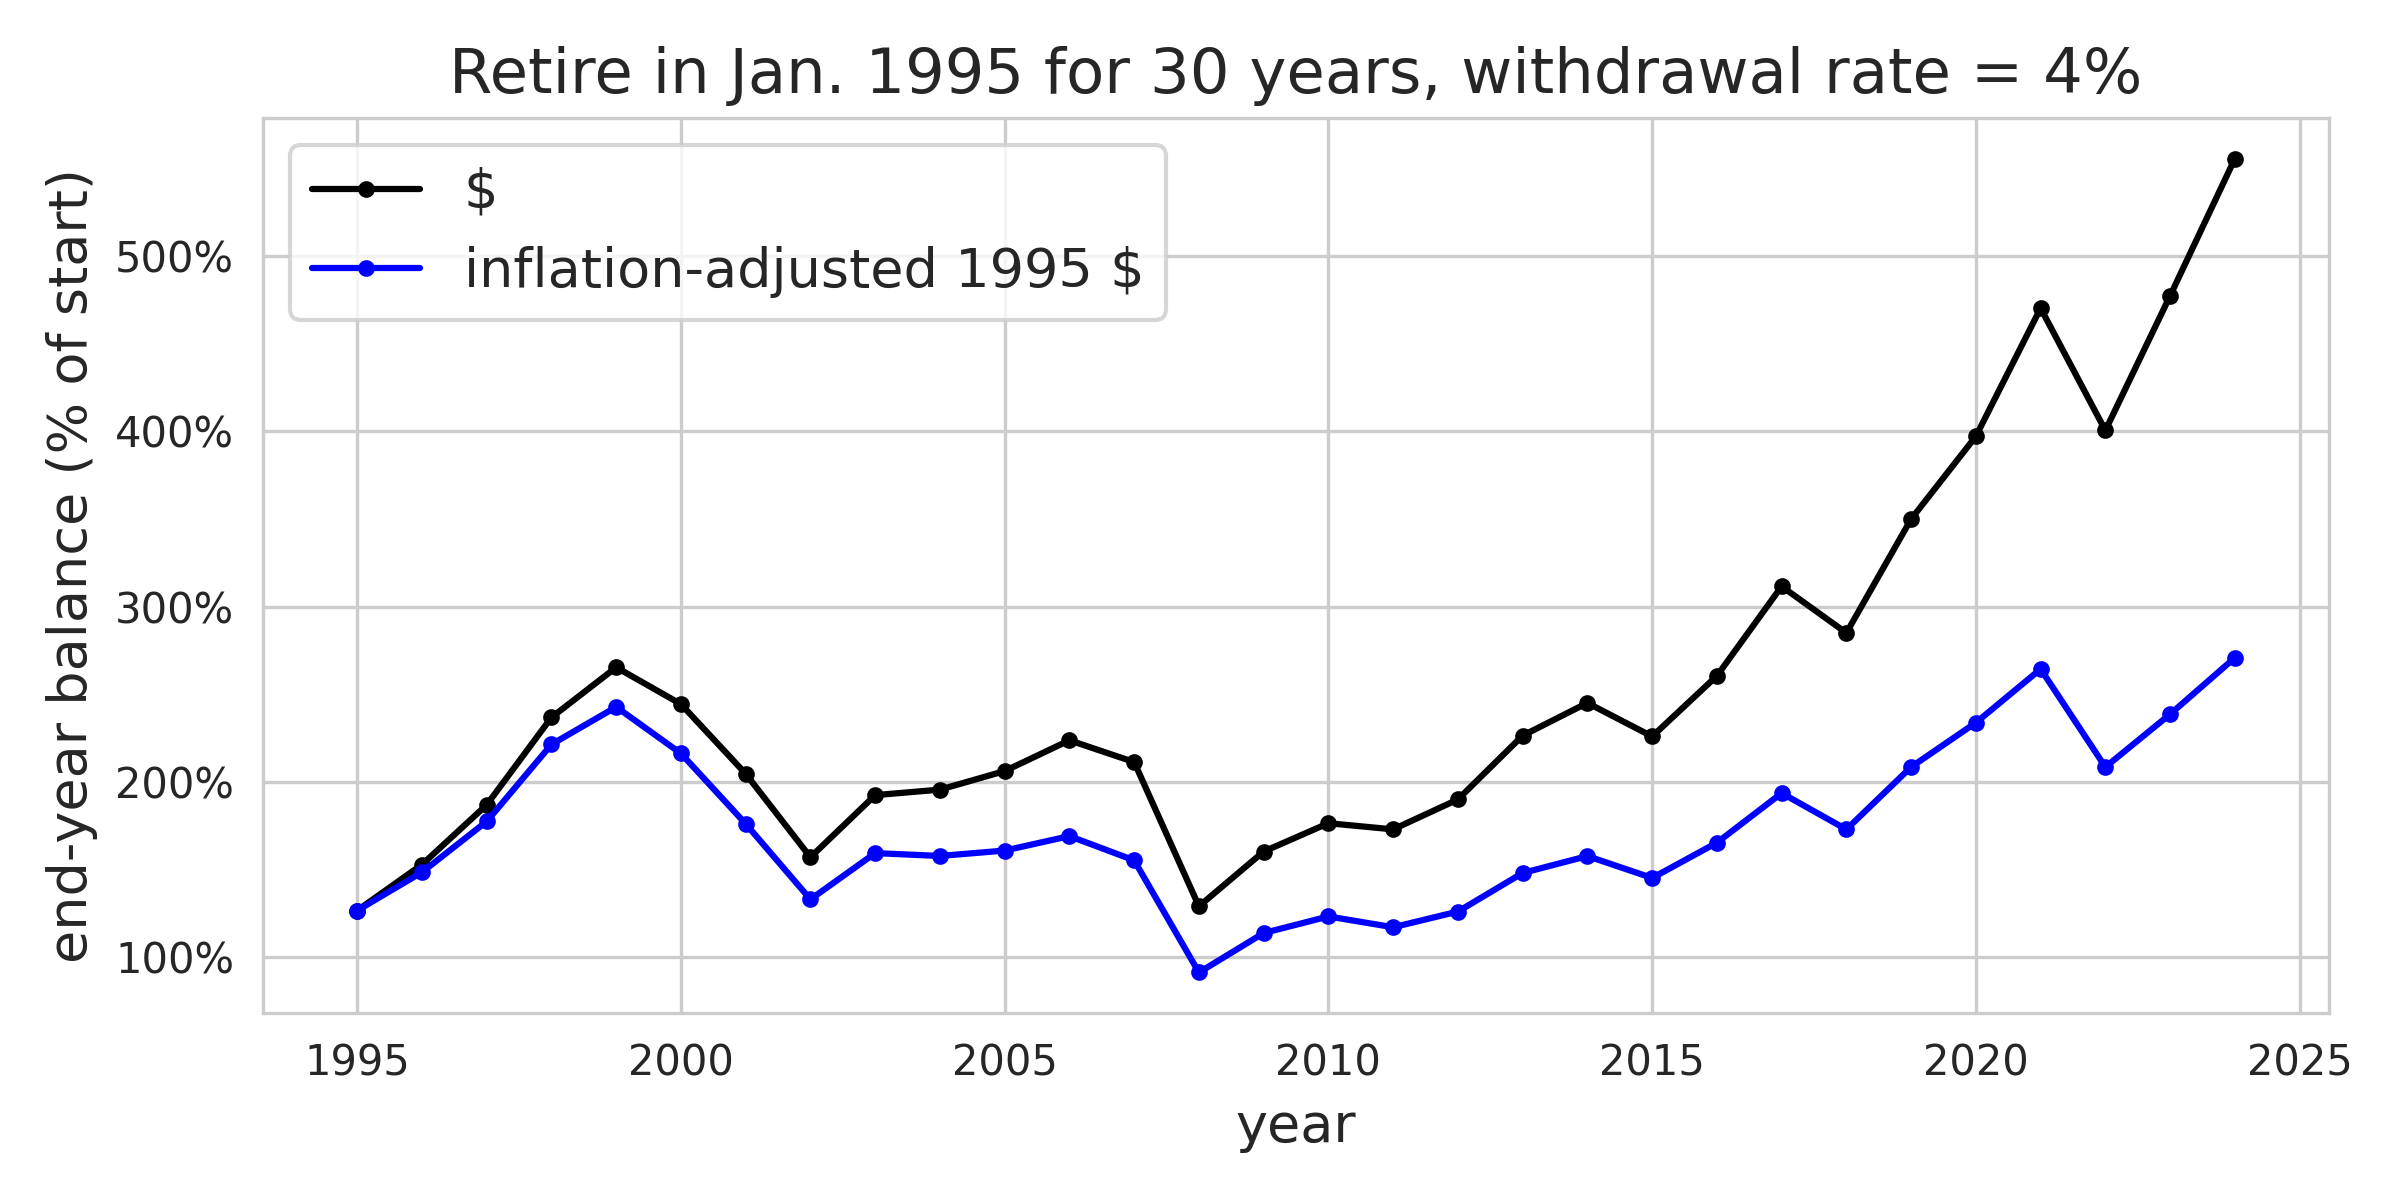
Figure 2. If retired in 1995 with a 4% withdrawal rate, what would the performance look like year-to-year? Pretty solid. Even more buffer room after 30 years of retirement!
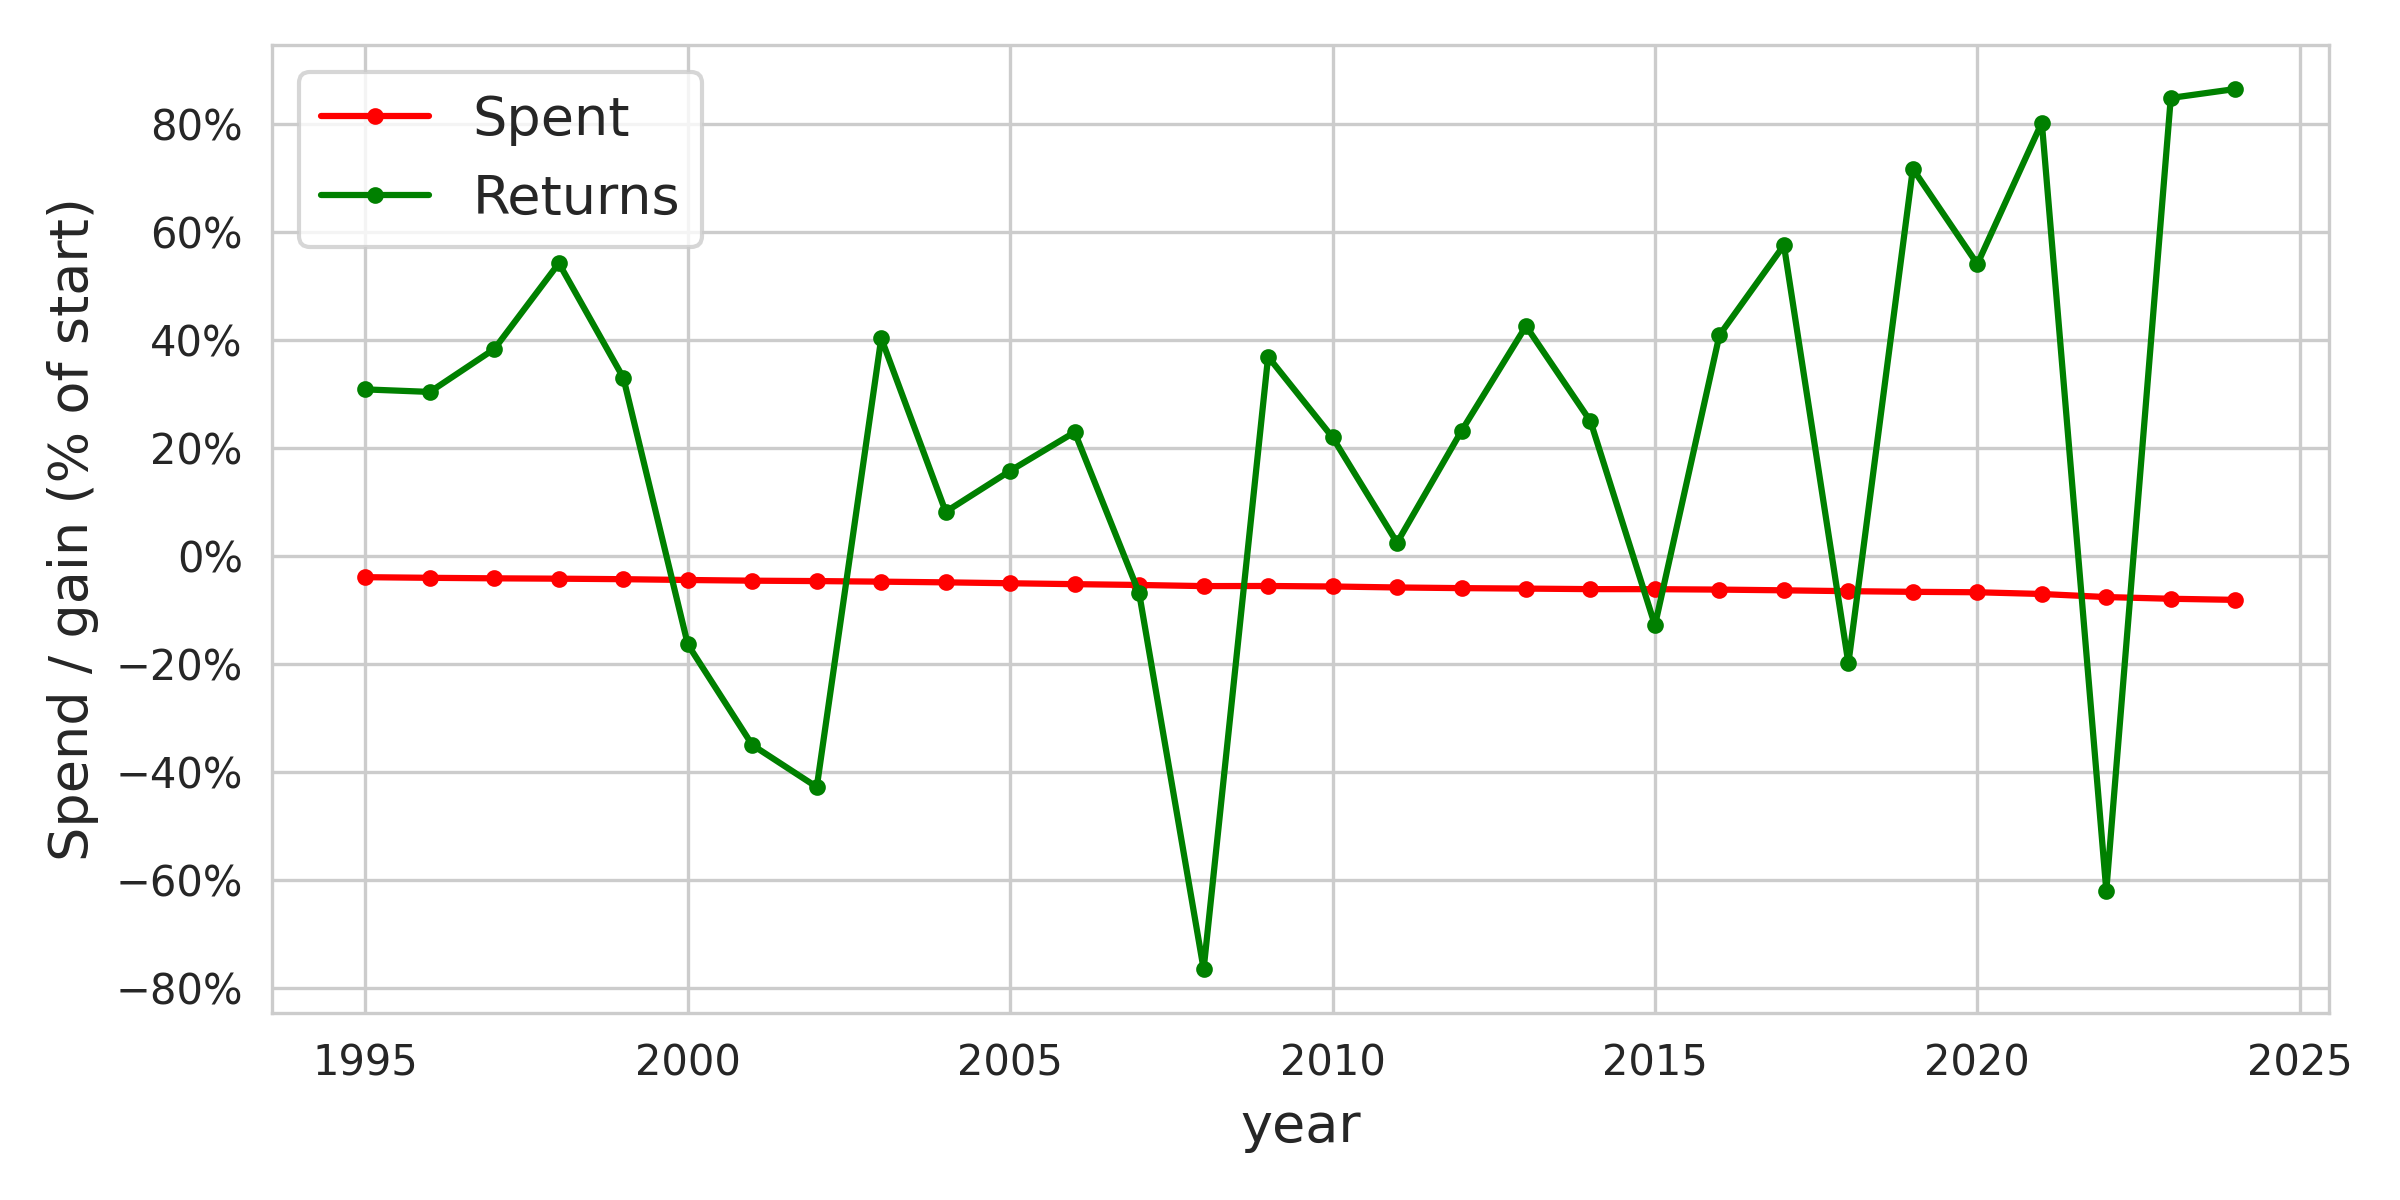
Figure 3. If retired in 1995 with a 4% withdrawal rate, what would your spending and returns be each year?
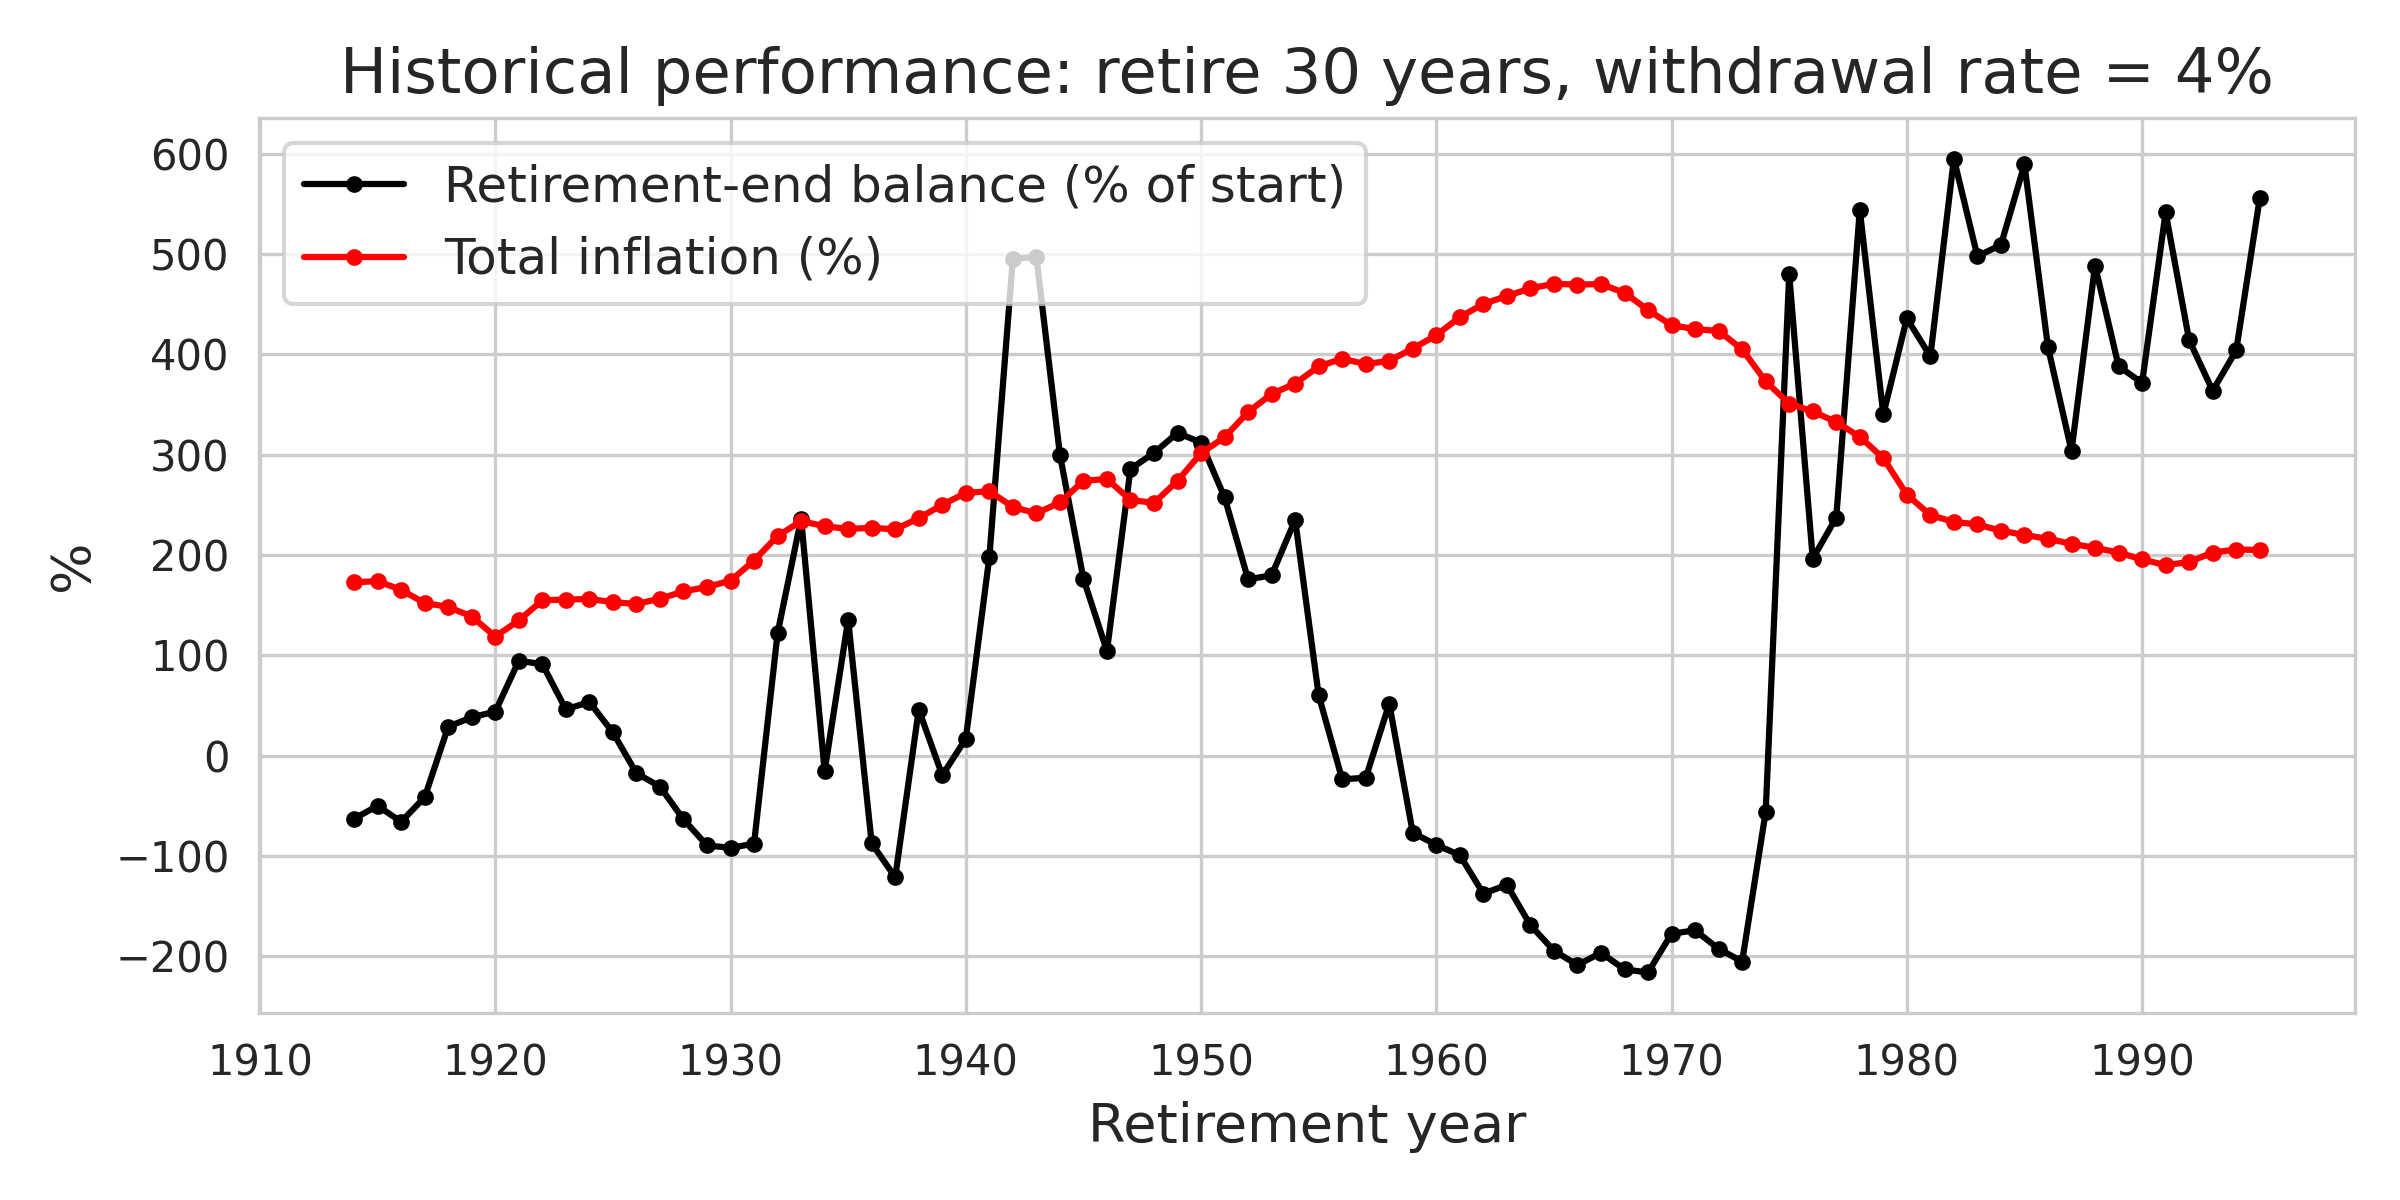
Figure 4. If retired with a 4% withdrawal rate, what would be your balance at the end of 30 years for each retirement year X?
Motivation
A key motivation for this analysis is that common advice is based on average market returns, but the market is very nonstationary, so results will vary wildly depending on the exact timing. To get a better idea of the spectrum of outcomes, I essentially simulated retirement at the beginning of each year back in time to see in which scenarios gains could outpace spending.
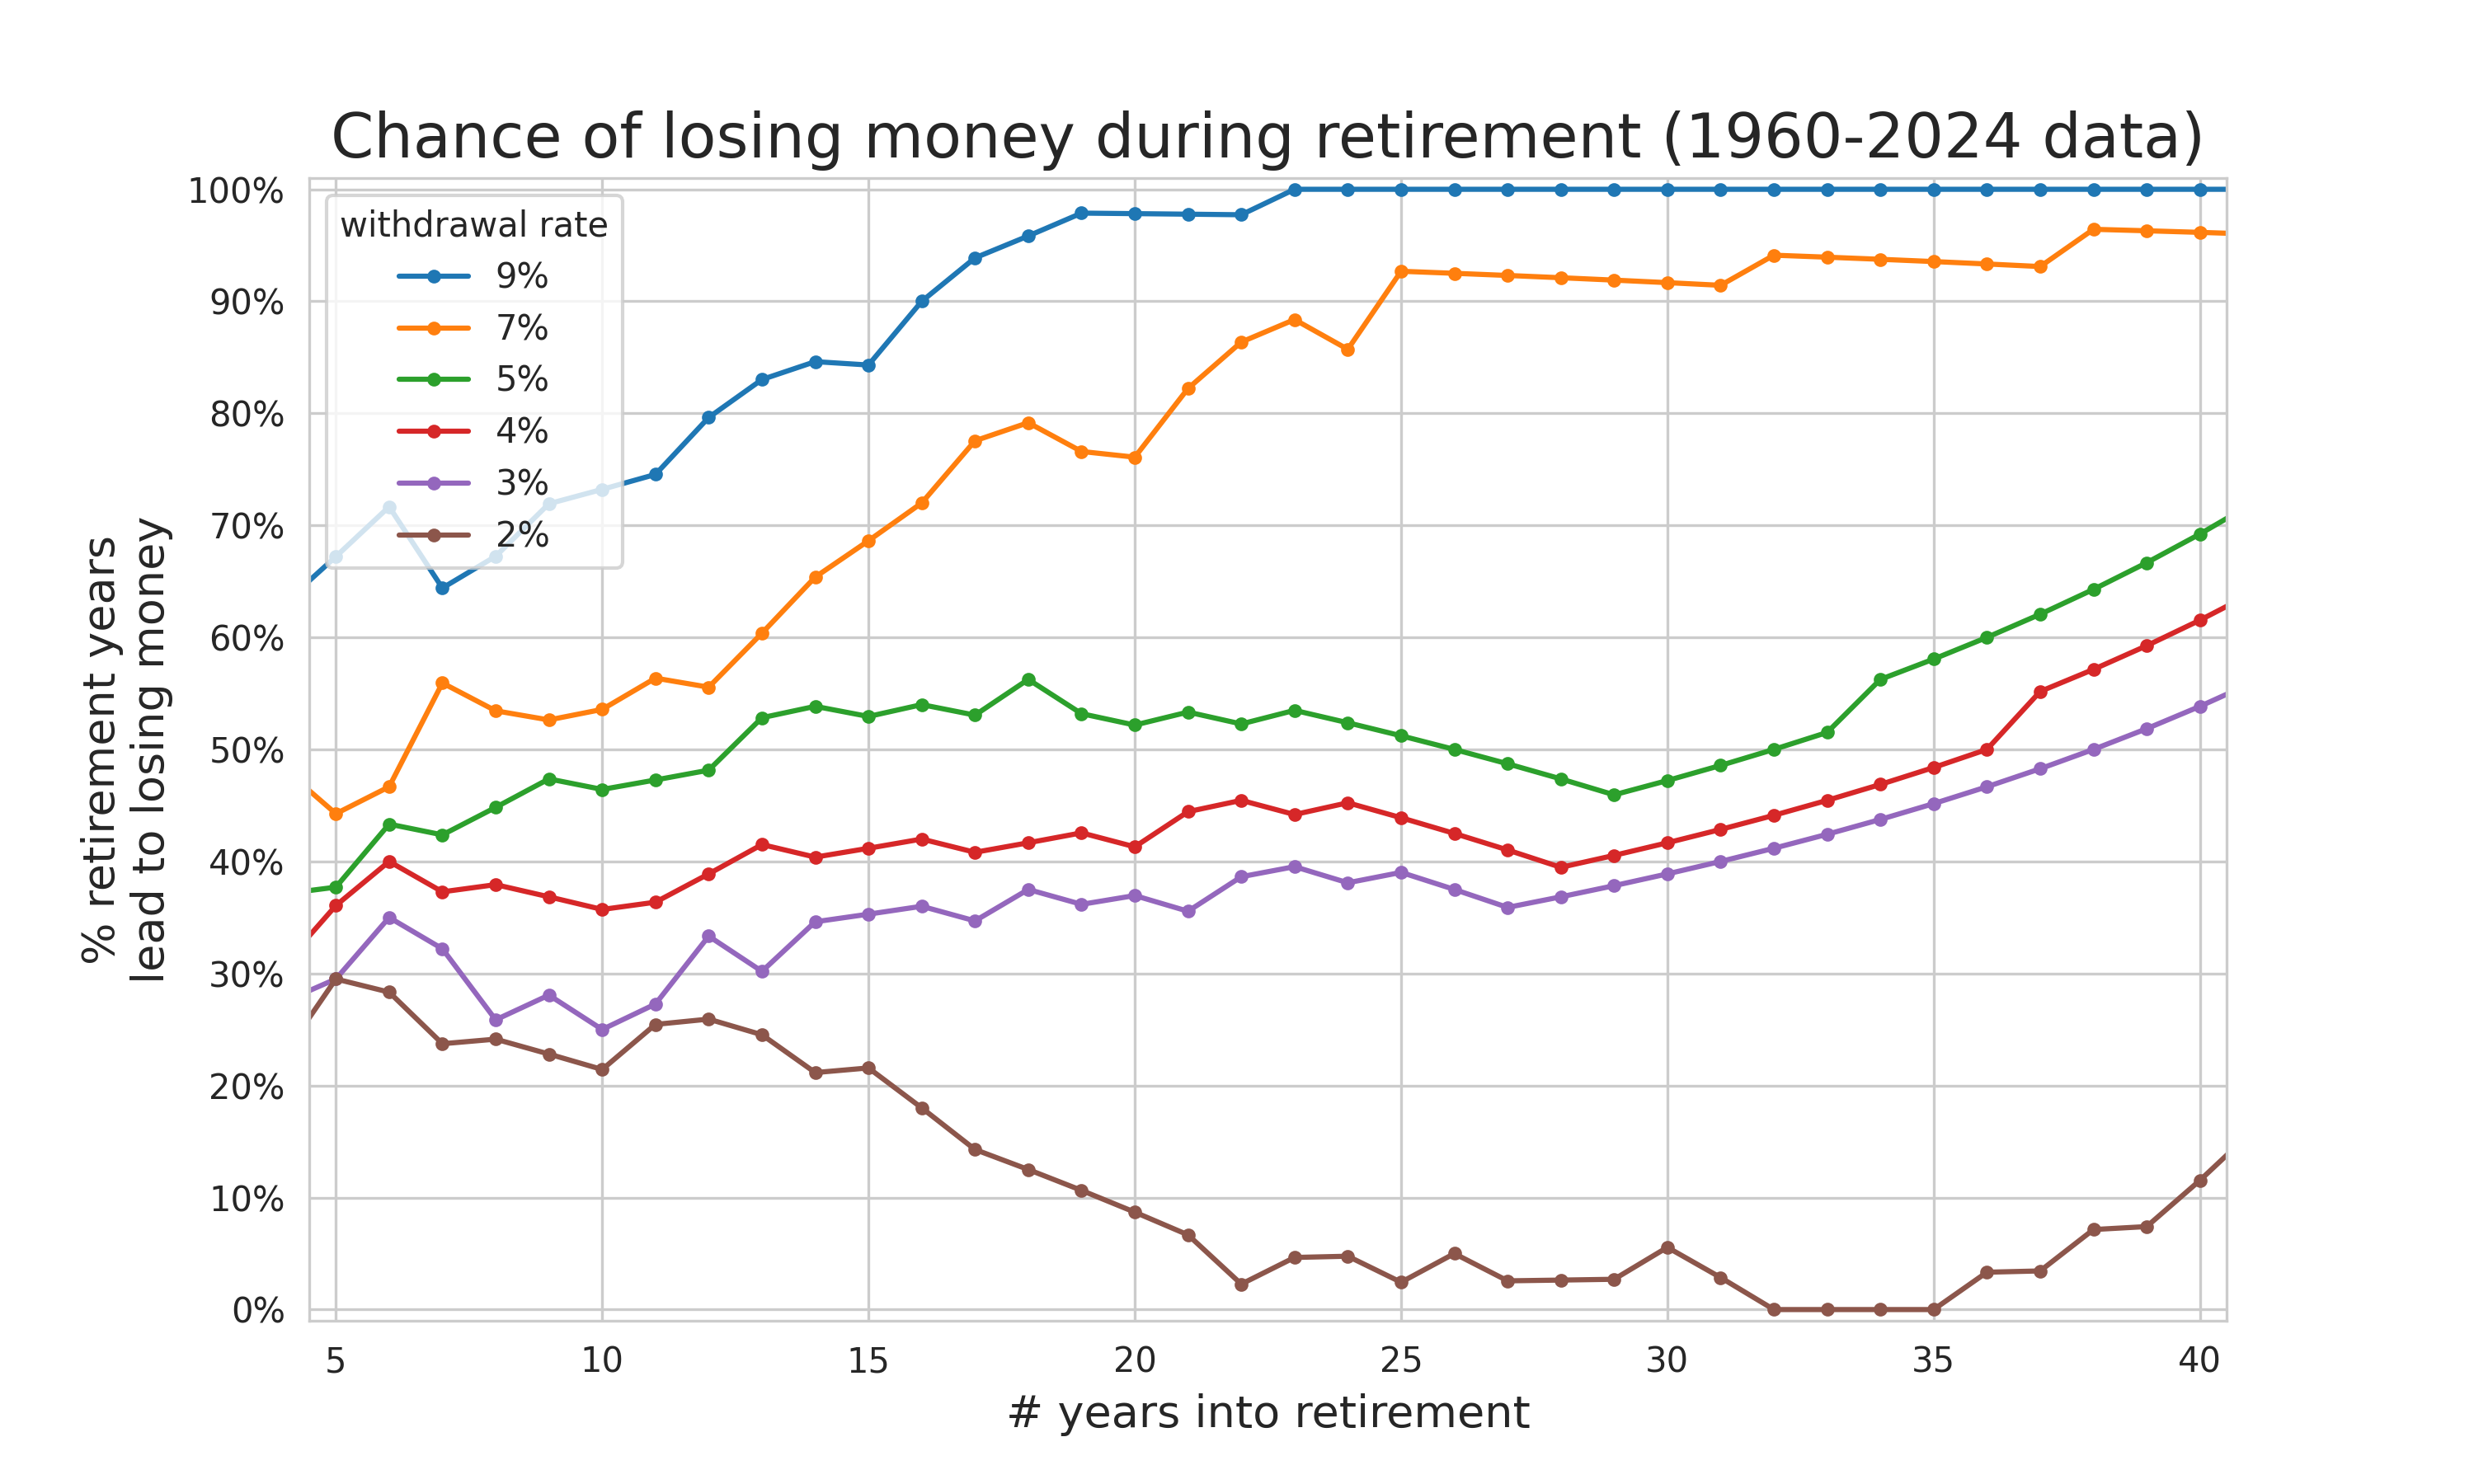
Figure 5. Same as Figure 1, but % of years end up with less equity than started.
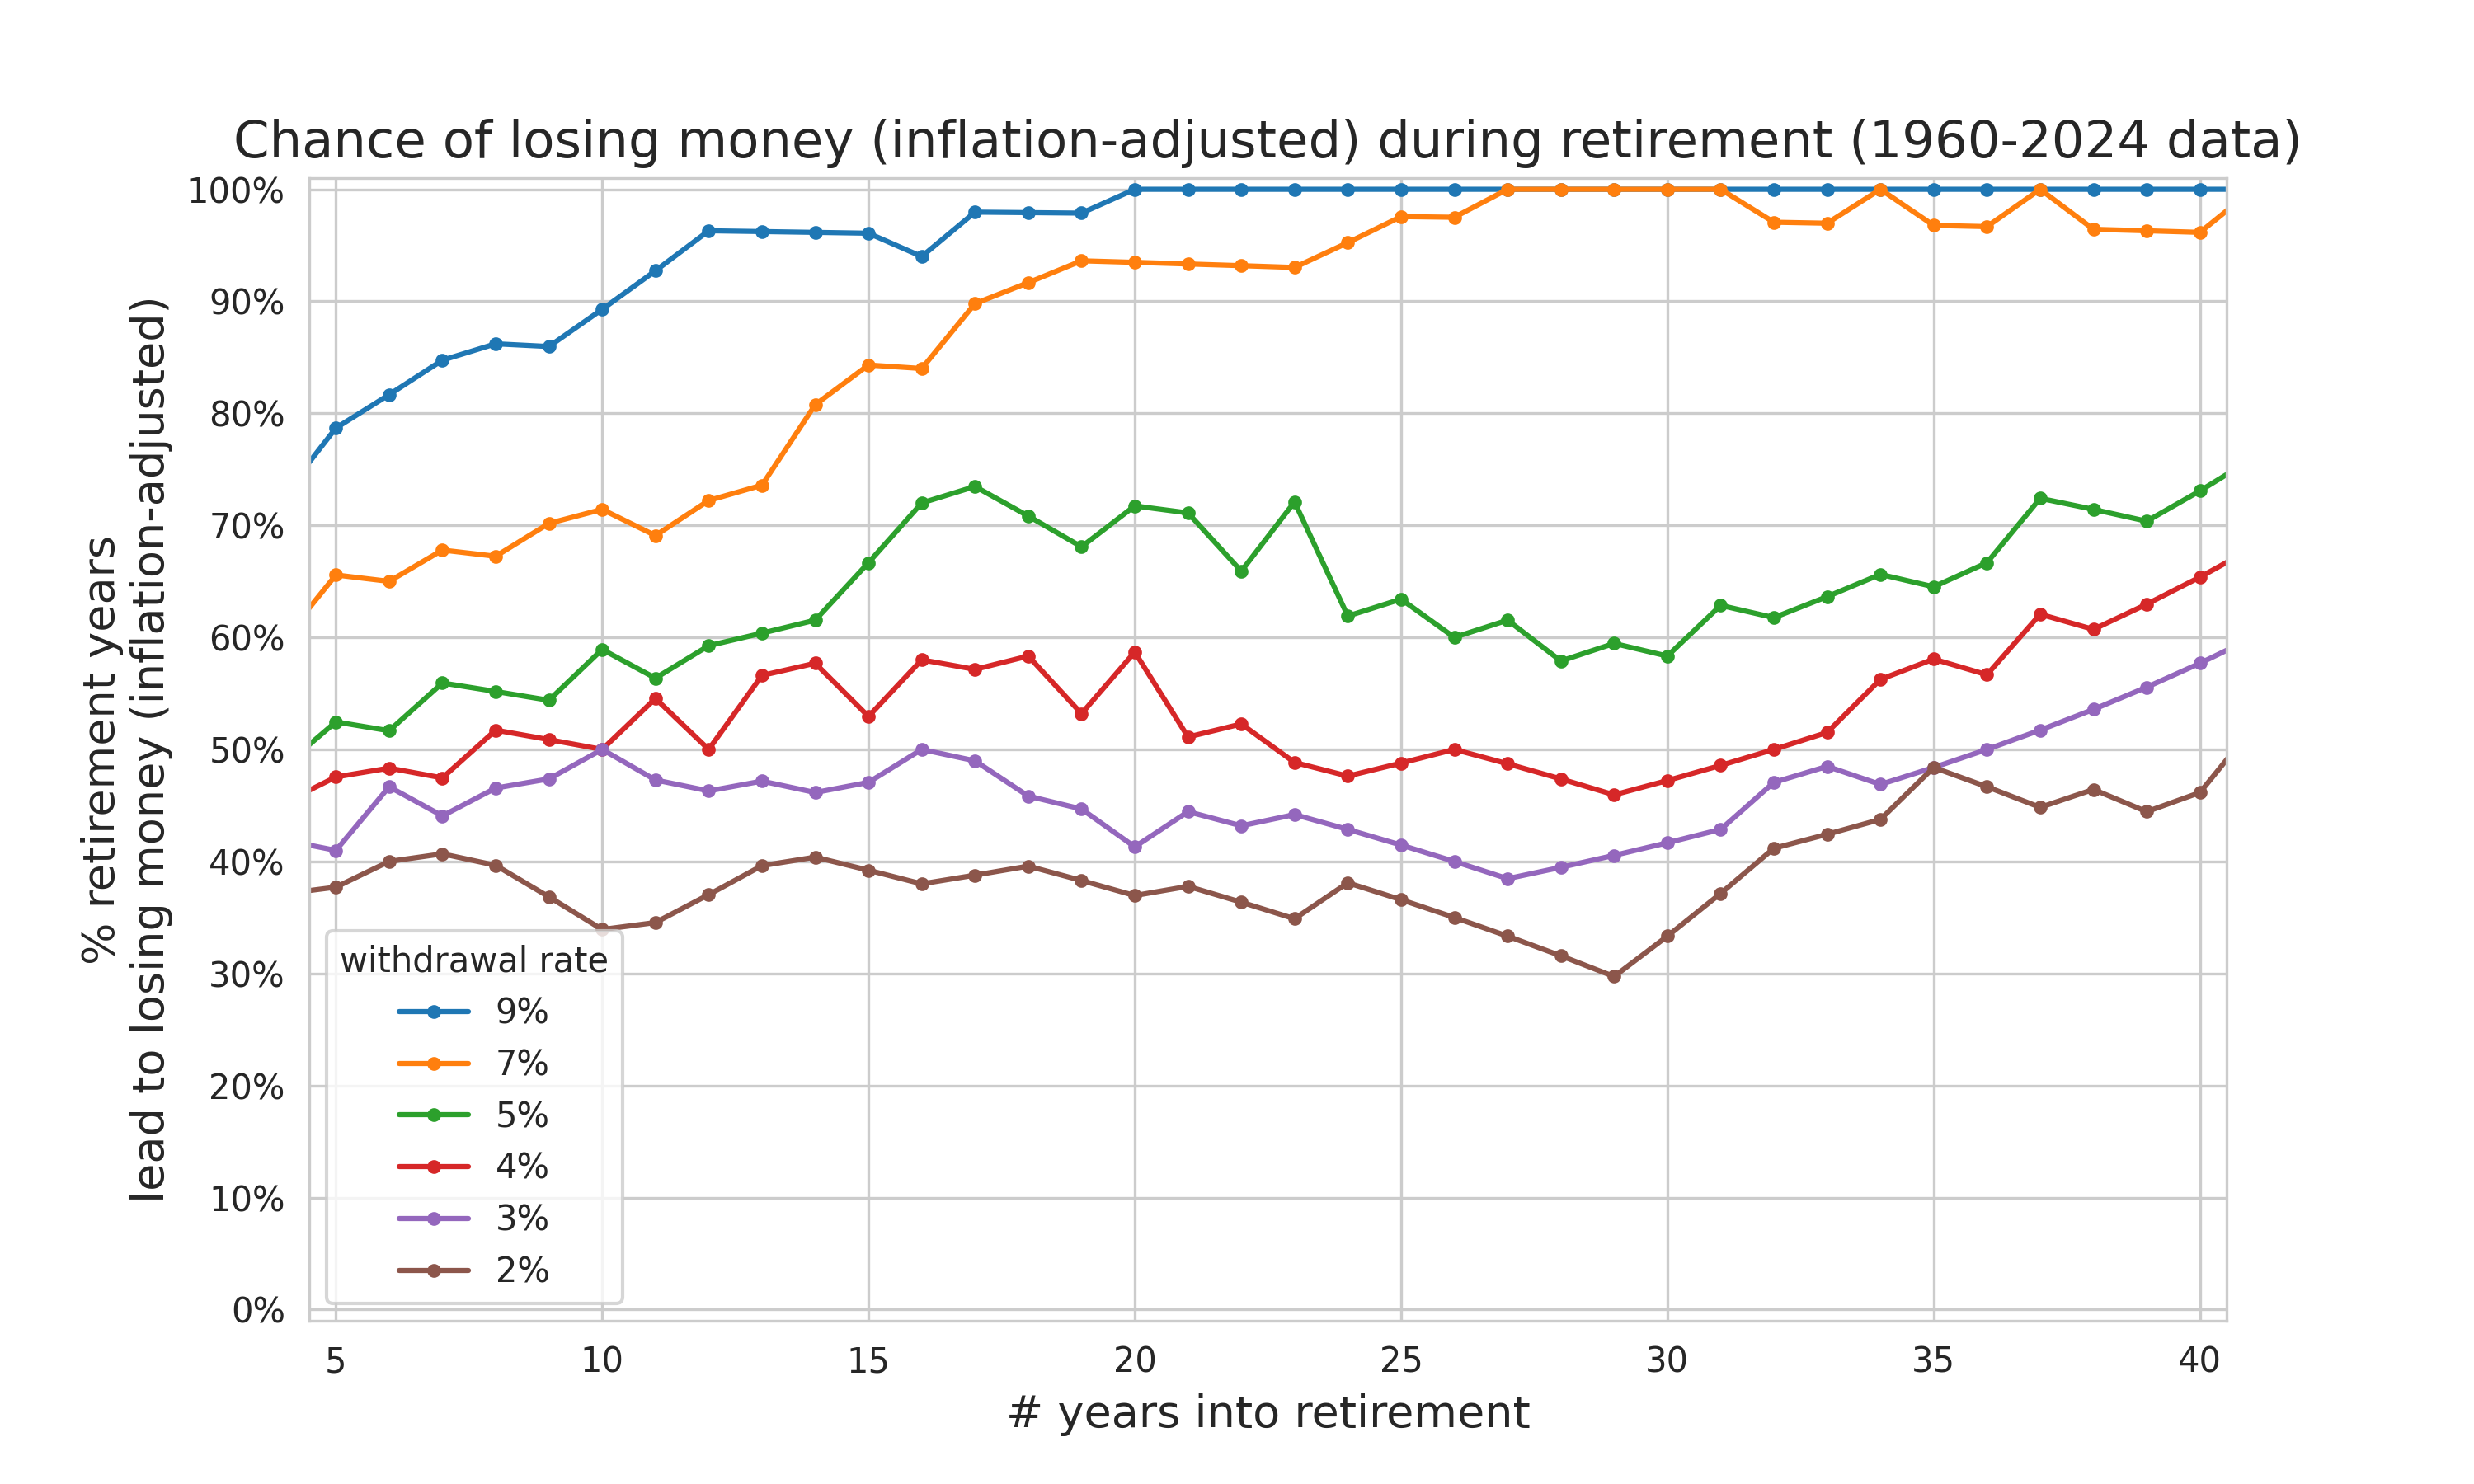
Figure 6. Same as Figure 1, but % of years end up with less equity than started, inflation-adjusted.
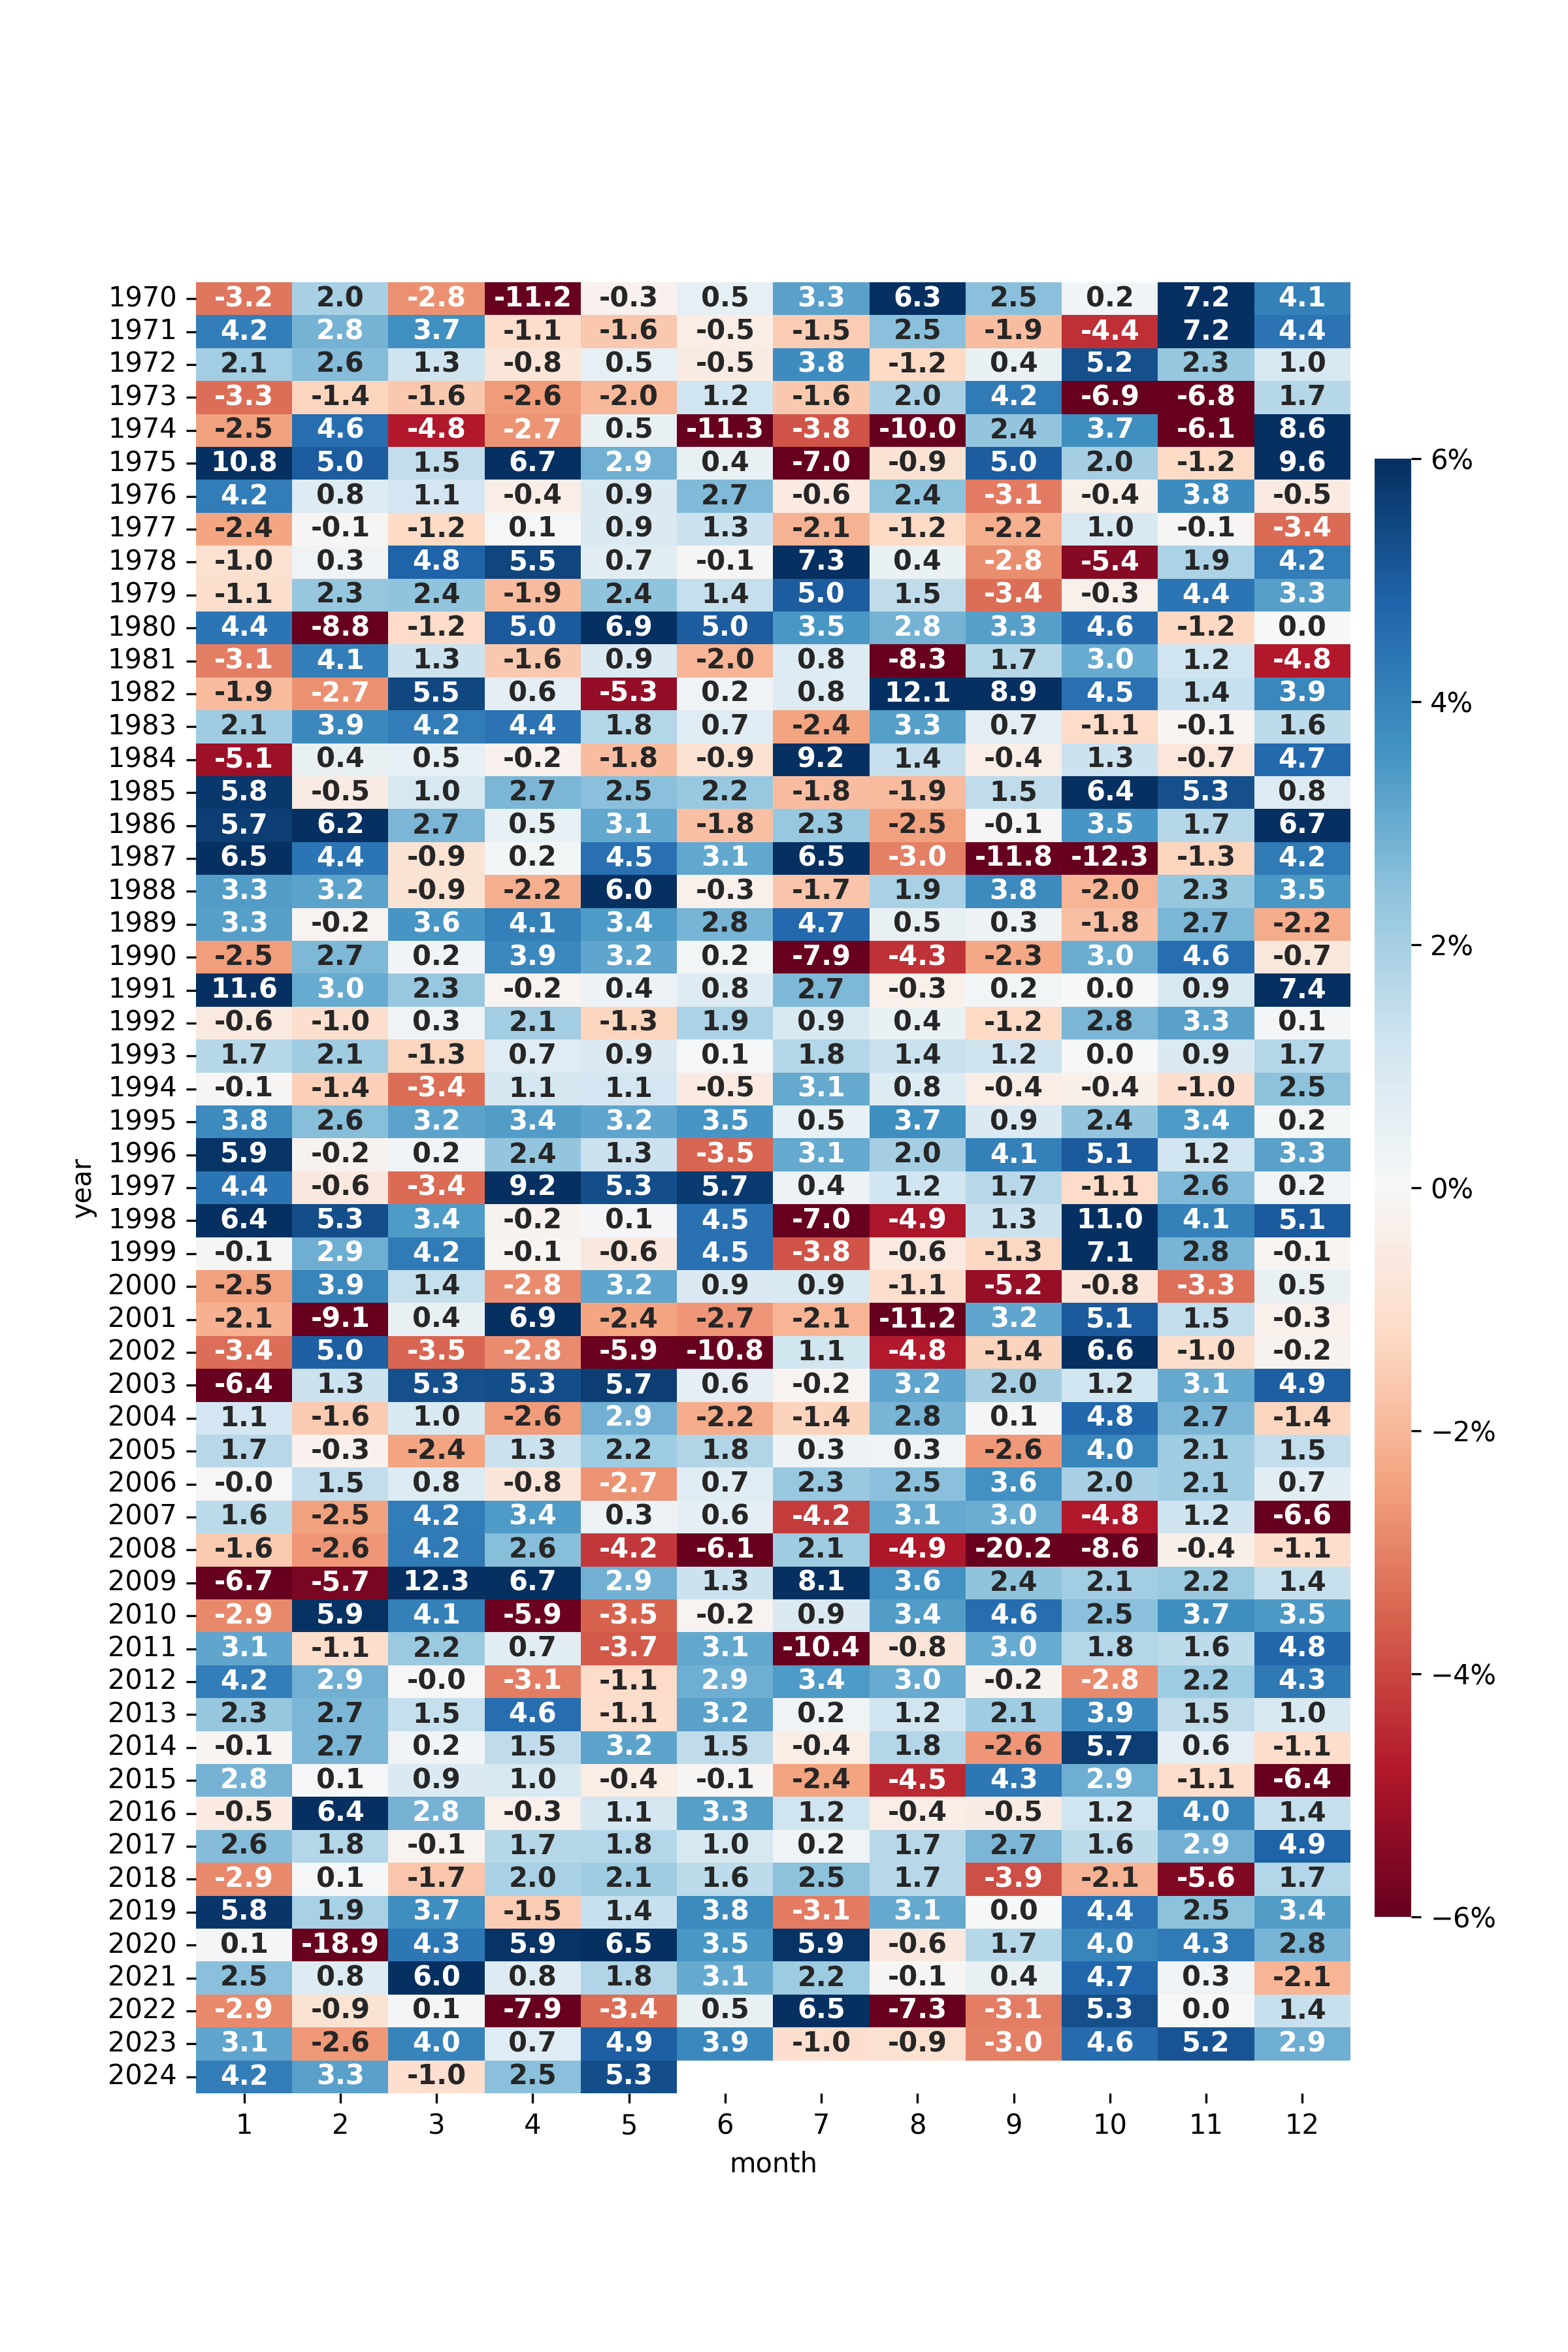
Figure 7. SPY monthly returns. Didn't find much of a month-of-year effect.

Figure 8. Historical performance of SPY returns after 5 years.

Figure 9. Historical performance of SPY returns after 10 years.

Figure 10. Historical performance of SPY returns after 20 years.