Delays of US domestic flights: trends and predictability
April 02, 2017
The US Bureau of Transportation Statistics collects thorough data on flight operations, notably precise recordings of delays. Because delays in air travel are annoying, it’d be cool if we could improve our ability to anticipate flight delays. So, for our term project for a Web mining course at UCSD, labmate Tom Donoghue and I explored this data set and tried to predict whether a flight would be significantly delayed. You can see our full report and GitHub repo.
We analyzed data from Kaggle of all domestic flights in 2015 (~6 million). After limiting the dataset to only include flights between the 98 airports with at least 20 departing flights each day, we were left to analyze 5.25 million flights.
Trends in flight delays
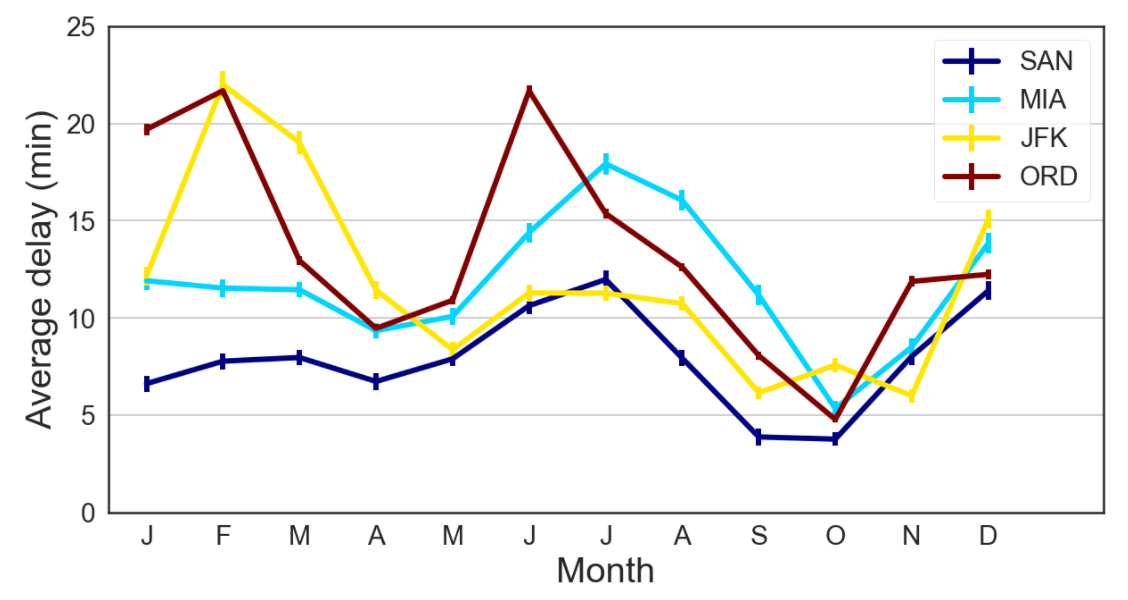
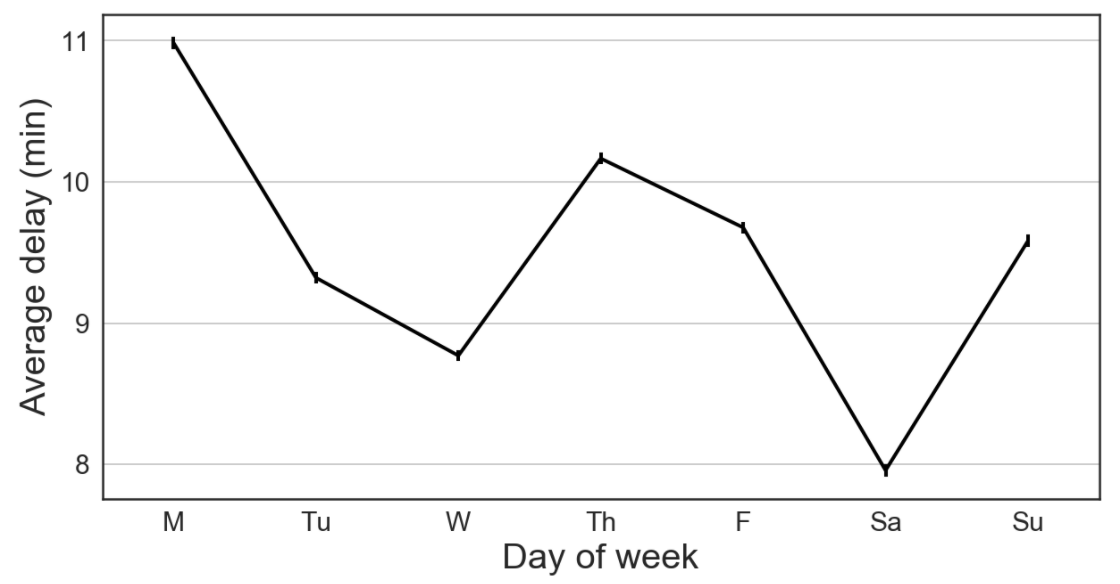
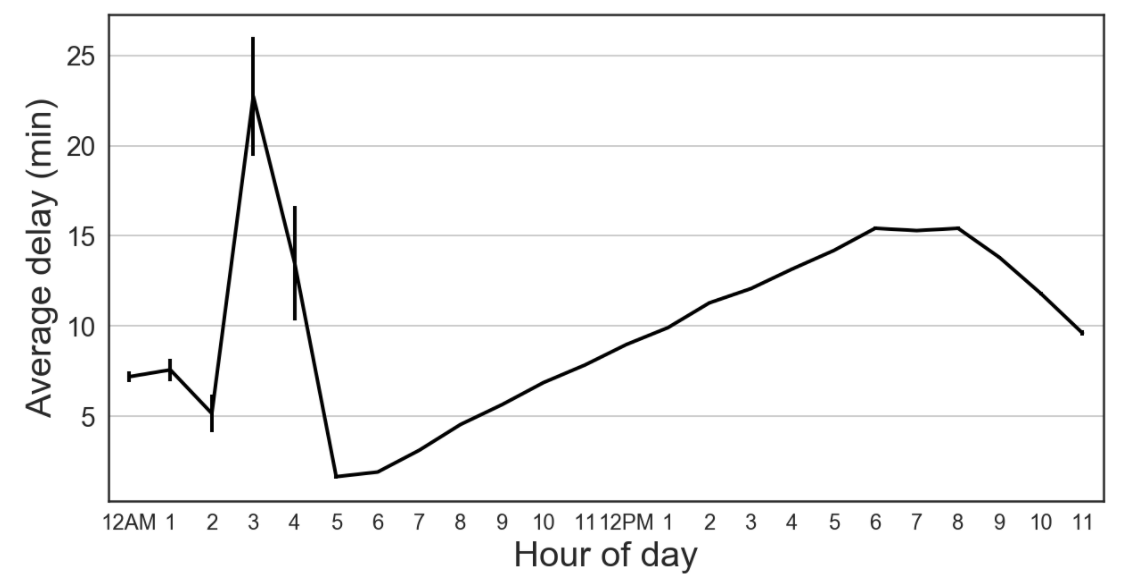
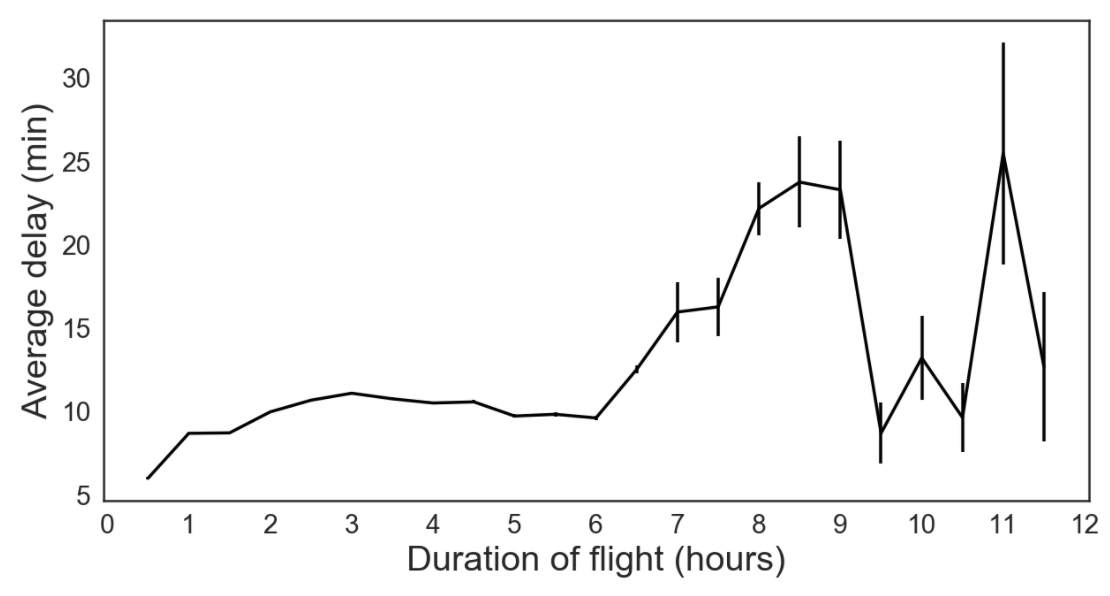
The figures below, which are generated in this notebook, explore how flight delay relates to:
- Time of year, month, and day
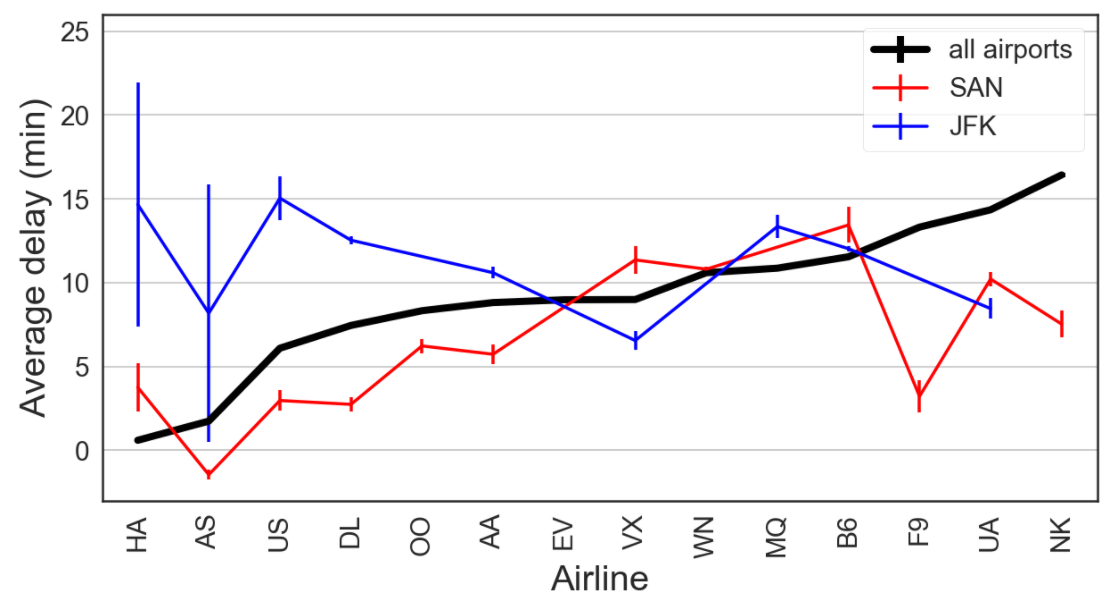
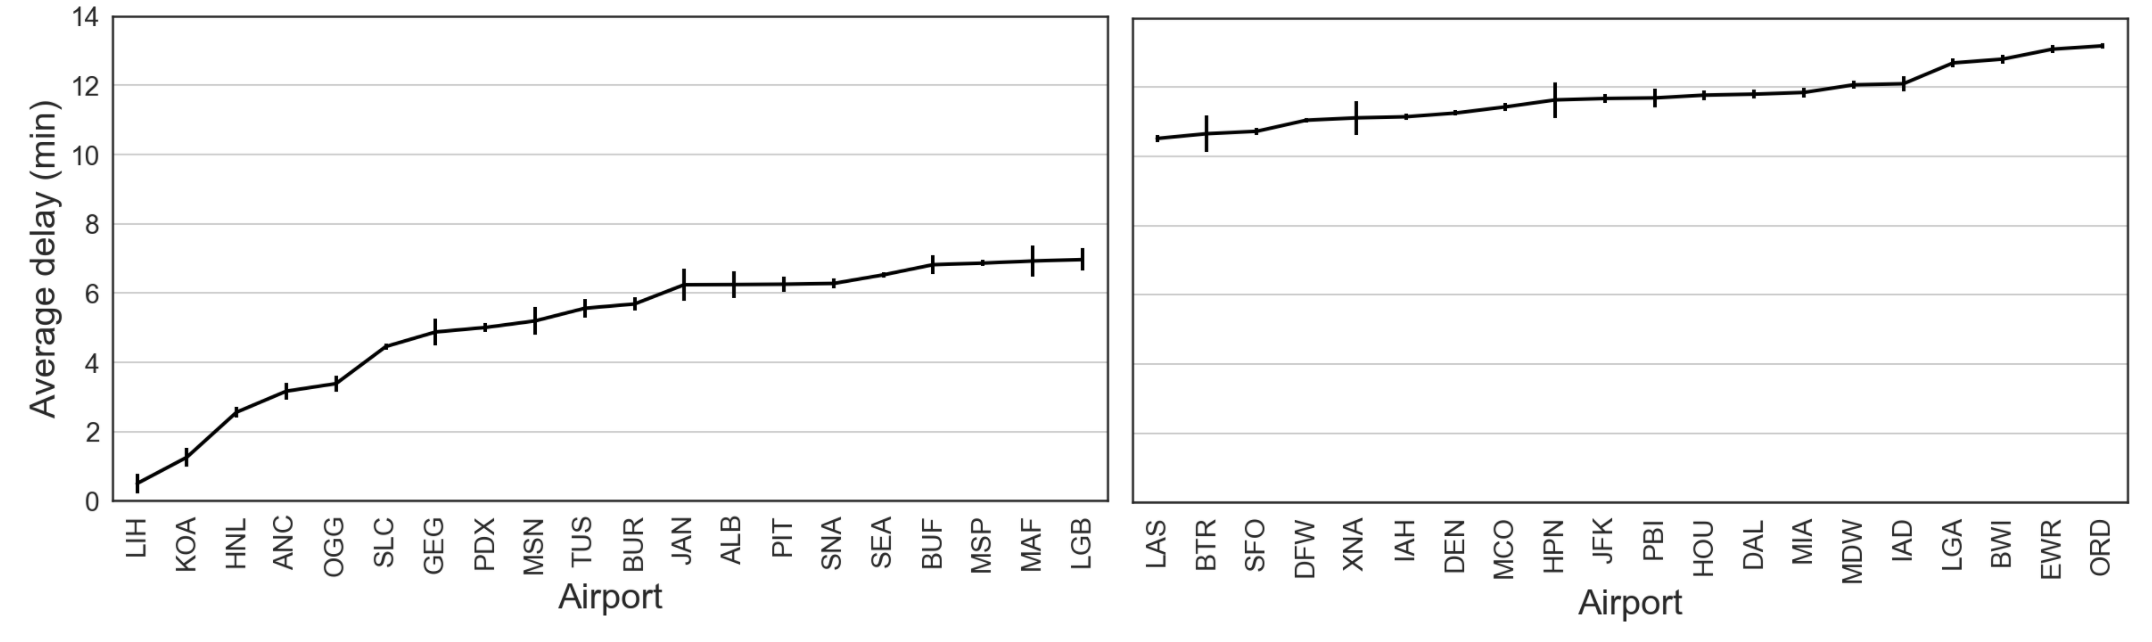
- Flight duration, origin airport, and airline operator
Predicting flight delays
Our prediction problem is perhaps ill-posed. We are trying to predict whether a flight will be delayed without any knowledge of weather conditions or the recent status of the flight network. But since we don’t have this knowledge when booking plane tickets, this predictor would help inform us which tickets may be most reliable. As seen in the trends above, we may want to book our itinerary on a Saturday morning in October if we want to minimize our flight delay. We would also lean more towards booking through US Airways or Delta rather than United or Spirit.
For our project, Tom and I chose to approach prediction as a classification problem: will a flight be delayed by more or less than 15 minutes? Since only 18% of flights will be considered delayed, a raw accuracy score isn’t very informative (i.e. predicting always ‘not delayed’ will have an 82% accuracy, which sounds better than it is). We instead evaluate our models using the area under the ROC curve (AUC). So chance prediction has an AUC = 0.5, and perfect prediction has an AUC = 1.
For our features, we one-hot encoded each of the variables in the figures above which related to flight delay. For example, there are features that take a value of 1 if the flight is on Monday, or Tuesday, or Wednesday, etc.; if the flight is on Hawaiian airlines, or United, etc.; if the flight is between 1-2 hours, or 2-3 hours, or 3-4 hours, etc. We trained separate logistic regression models for each airport and used 70% of the flights (3.7 million total flights) departing that airport for training, and 30% (1.6 million) for evaluating our model. You can find the python code for our model here.
Using this technique, we achieved an AUC = 0.689.
Prediction performance: A precision - recall tradeoff
Because of the number of flights delayed and not delayed are very unequal, using a 50% probability (of delay) cutoff as our decision threshold, we predict nearly all flights will not be delayed. However, of the 7,197 flights we predicted as delayed, 54% of them were actually delayed (i.e. our precision). This is significantly better than chance (18%). However, of the actually delayed flights, we only predicted that 1.4% of them would be delayed (i.e. our recall), which isn’t great.
Therefore, we may prefer to predict a flight will be delayed if the logistic regression model outputs at least a 30% probability of delay. In this case, our precision drops to 37.4%, but our recall rises all the way to 27.4%. Therefore, if your flight is going to be delayed, there’s a 27.4% chance that this model would have predicted it. But if your flight wasn’t delayed, there’s a 10% chance that our model would have guessed it was delayed.
That level of accuracy might not seem great, but given this model can be used without knowledge of weather or the status of recent flights, it’s not bad.
Potential future model improvements
Because this project only lasted a bit longer than a week, and we have neuroscience to do, there was a lot of interesting analysis that we unfortuantely didn’t get around to. Though we didn’t see any improvements with our first attempts of SVMs or random forests, tuning these models could prove to give better accuracy than logistic regression.
There are a bunch of other fun things you can do with this data, such as looking at trends in cancellations, or incorporating weather history and recent flight status to obtain more accurate, short-term, predictions. Having done this project, I’m interested in any extensions you guys are doing or have done. So if you have, please tweet them at me!