Poster popularity at SfN 2016: Cognition and systems are hot. Development is not.
November 27, 2016
The Society for Neuroscience annual meeting is arguably the most important neuroscience event each year, and the thousands of poster presentations are a big part of the fun. Some posters are more popular than others, for a variety of reasons, and the ability to predict the popularity of posters would be really interesting.
Therefore, I spent about 5 hours over a few afternoons at SfN collecting data on poster popularity. Specifically, I counted how many people were actively engaged with a poster as I walked by (for more information, see Supplementary Methods below). Overall, I collected 3650 observations from 2579 unique poster boards. By relating this data to information in the abstract booklet, we can attempt to analyze what features are predictive of popular posters.
Results, see IPython Notebook
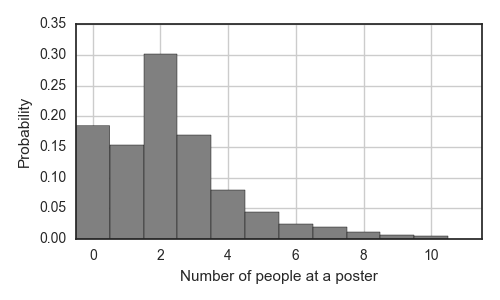
First, it is useful to characterize the distribution of engagement across individual posters. As expected, this distribution decays for an increasing number of people, but we note that it is most likely (30%) that there will be 2 people engaged at a given poster*. There was at least 1 person at 1954 of the 2579 (75.8%) posters; 43 posters (1.7%) were withdrawn, 142 posters (5.5%) were not posted at the time of walking by, and 440 (17.1%) of poster boards had a poster on them with no one present.
I hypothesized that this distribution is not identical for each subfield of neuroscience that is represented at the SfN conference. Each poster was classified under a theme, the 8 most common of which are listed on the y-axis in the figure below. The themes are sorted by the average number of people at a given poster, which varied from 1.7 people/poster in the Development theme to 2.7 people/poster in the Cognition theme. The probability distribution for poster popularity is shown in color, separated vertically by theme.
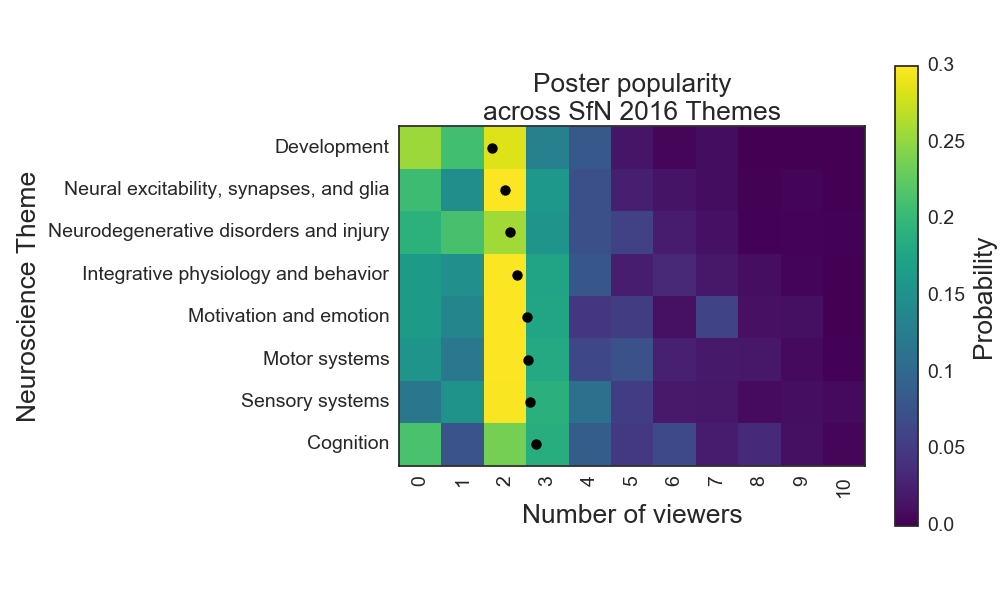
From this figure, we can see that posters about cognition were more popular than those about nervous system development. This was statistically robust for the two sessions in which at least 50 posters were counted for each theme (unpaired t-tests, p < 0.001). Poster popularity was also significantly higher for the systems themes (sensory and motor) compared to nervous system development.
Conclusions, implications and caveats
From my biased viewpoint, I was not surprised by these results. I would much rather talk about how the brain processes sensory input, how it coordinates motor actions, or how it somehow manifests cognitive processes, than to analyze gradients of sonic hedgehog in the developing vertebrate. Perhaps this new dataset indicates that this sentiment is more common than the opposite one in the attendees of the annual SfN meeting.
However, there are some important caveats to this study because data collection was severely limited. The poster hall is busier at some times compared to others. This nonuniformity in traffic, coupled with the nonrandom layout of posters by topic, could yield spurious effects across topics. It is also suboptimal that the data collected for each theme is not randomly sampled across that whole theme, but rather the data collected came from a handful of sub-topics to each theme (e.g. ‘posture and gait’ is a subtopic in ‘Motor systems’). However, the high degree of significance in the current analysis in multiple poster sessions, lends more support to the main conclusion here.
I believe that the neuroscience community could benefit by data collection projects at future SfN annual meetings. Rather than manually collecting data, cameras can be mounted on the ceiling, and machine vision tools could automatically extract information not only on poster popularity but also on the flow of neuroscientists through the poster hall. This would be an incredibly interesting dataset and valuable for the SfN.
Perhaps in the future, when the SfN organizers are laying out their poster hall, and they have some extra space, they may choose to distribute this space disproportionately between rows of posters on systems and cognitive neuroscience. Our data indicates that the space would be better utilized around these posters.
And there will be more to come from this dataset.
Supplementary methods
Observations were collected at a rate of 12 posters per minute. An iPhone5 with the Google Sheets app installed was used for data entry. Data was collected for one row (A, B, …, AA, BB, … , MMM) at a time, from the first poster in the row to the last poster in the row. While walking past the poster, its popularity was measured as the number of people who were actively engaged with the poster or the apparent poster presenter, including the apparent poster presenter. Therefore, an entry of ‘2’ could indicate either the poster presenter discussing with 1 viewer, or 2 viewers silently viewing the poster, with no evidence of a presenter nearby. There were significant limitations in this data collection approach, and introduction of noise into the data was inevitable.
In order to optimize speed of data collection, no other information was collected at this time. The beginning of each row was marked in an adjacent column in Google Sheets. If the number of observations in a row did not match the number of posters in that row (according to the sign at the end of the row), all observations past the first one of the row were discarded. This mismatch was presumably due to missing a poster or counting a poster twice. Around 350 observations were lost due to this data collection error.
*A statistical mode of 2 is preserved when the data is partitioned into individual themes.