Clustering
Scott Cole
COGS 108 - Data Science in Practice
Link to slides: bit.ly/cogs108cluster
Link to notebook: bit.ly/cogs108clusternb
Not all structure in data is fit by a line
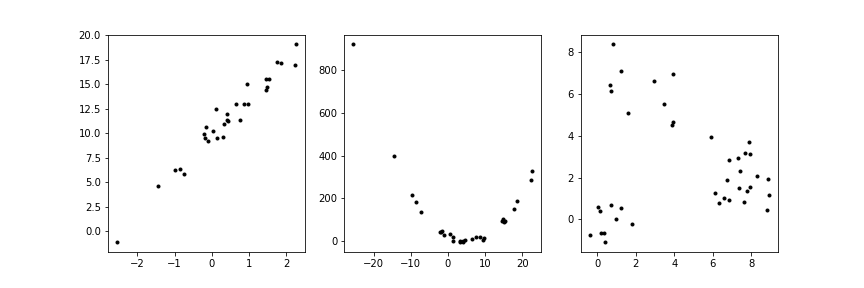
Clusters may represent different categories
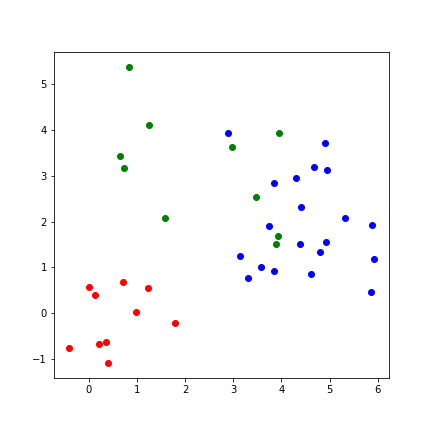
k Nearest Neighbors
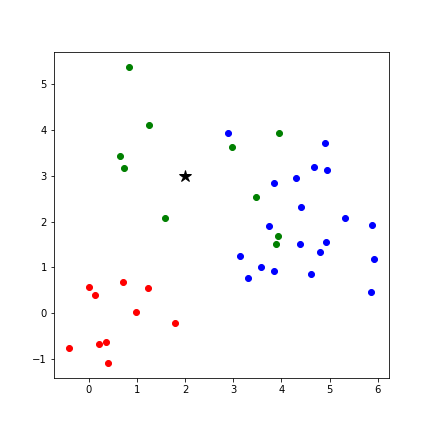
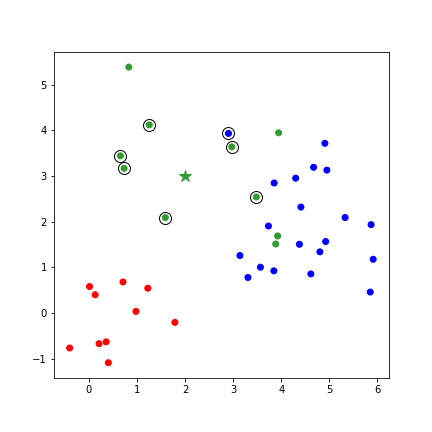
- k Nearest Neighbors (kNN)
- Category of a new point is the category held by the k nearest points
- "instance-based learning" - does not construct a general model. Simply stores observations.
kNN in python
In [10]:
from sklearn import neighbors
clf = neighbors.KNeighborsClassifier(7, weights = 'uniform')
clf.fit(X, y)
print(clf.predict([[0,0],[5,2]]))
- Also see:
- RadiusNeighborsClassifier
- KNeighborsRegressor
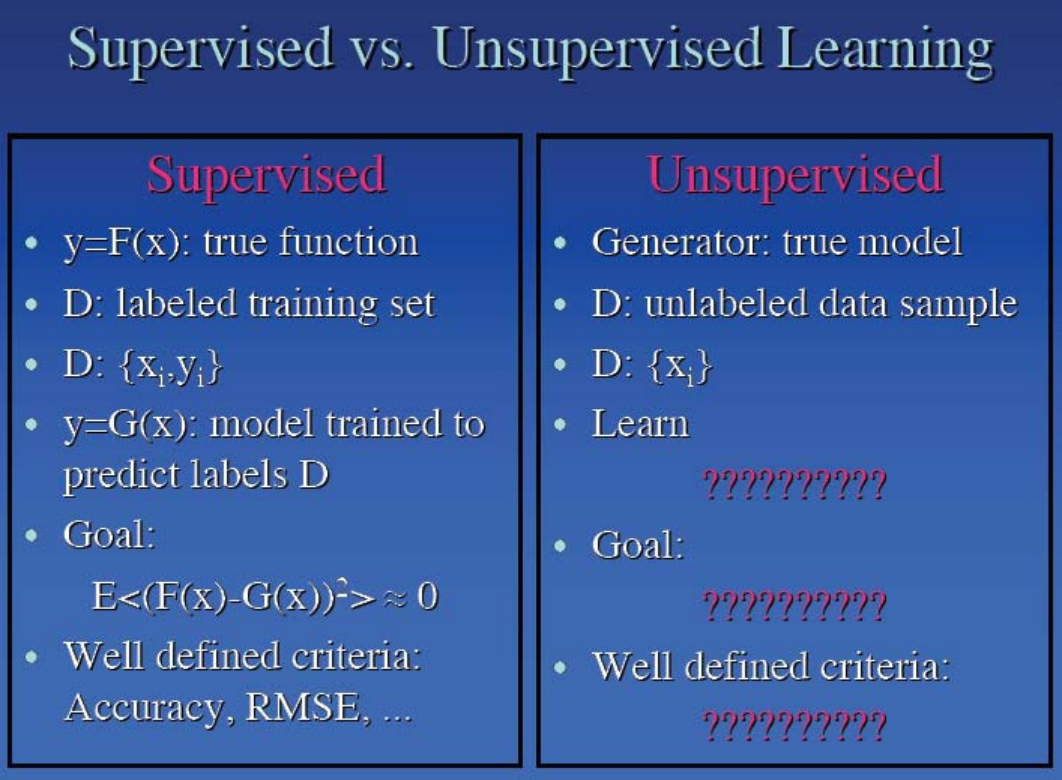
What if we don't have labels?
- Learn structure in the data by clustering together similar data points
What are clusters?
- A subset of objects such that the distance between any two objects in the cluster is less than the distance between any object in the cluster and any object not located inside it.
- A connected region of a multidimensional space containing a relatively high density of objects.
What is clustering?
- Definition: the process of partitioning data into a set of meaningful sub-classes.
- Purpose: Uncover natural grouping or structure
- Multiple use cases
- stand-alone tool to gain insight into data
- preprocessing step for other algorithms
- data compression
- Outlier detection
Goal of clustering
- High intra-cluster similarity
- Short distance between points in the same cluster
- Low inter-cluster similarity
- Long distance between points in 2 different clusters
Clustering applications
- Placement of cellular towers
- Minimize distance to users
- Pizza chain locations
- Minimize driving distance to customers
- Marketing
- Appeal to distinct subgroups of potential users
- Taxonomy
- Similarity between species
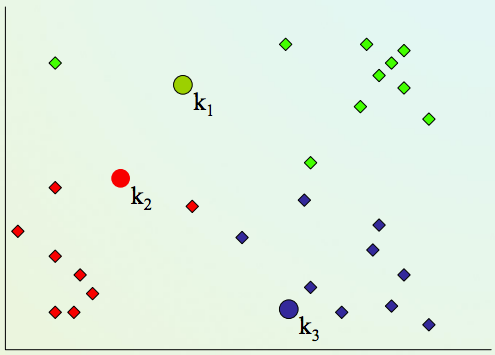
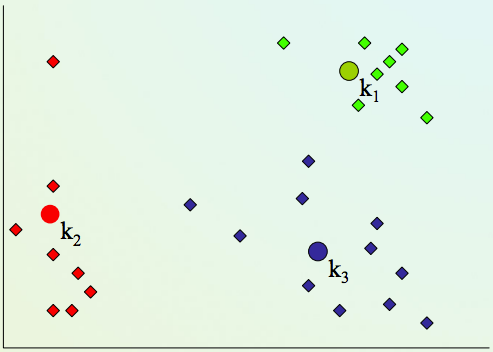
K-means clustering algorithm
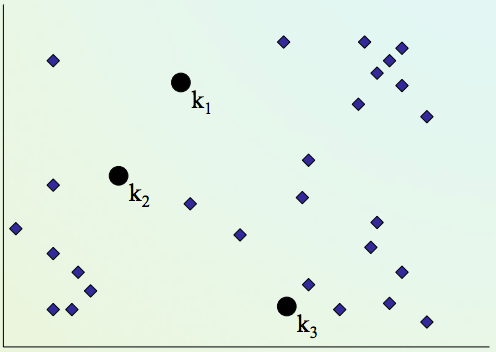
K-means clustering algorithm
2) Assign every item to its nearest cluster center (e.g. using Euclidean distance)
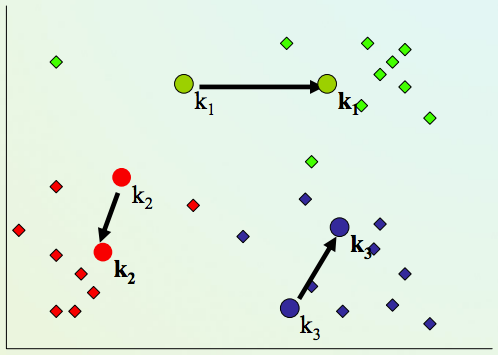
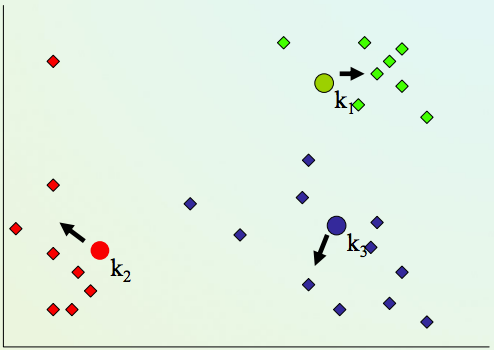
K-means clustering algorithm
4) Repeat steps 2,3 until convergence (change in cluster assignments less than a threshold)
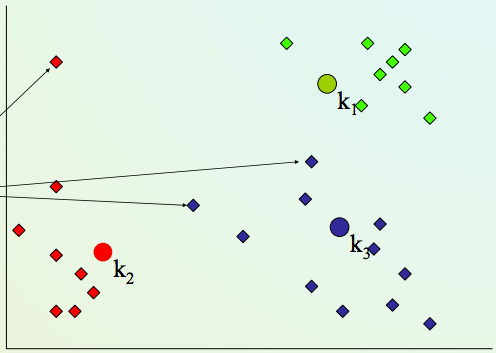
K-means clustering algorithm
4) Repeat steps 2,3 until convergence (change in cluster assignments less than a threshold)
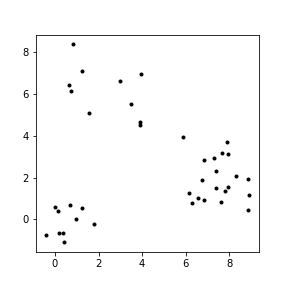
How to choose value of k?
In [11]:
from sklearn.datasets import make_blobs
plt.figure(figsize=(4,4))
X, y = make_blobs(n_samples=30, n_features=2, centers=3, cluster_std=2, random_state=0)
plt.scatter(X[:, 0], X[:, 1], c='k')
plt.show()

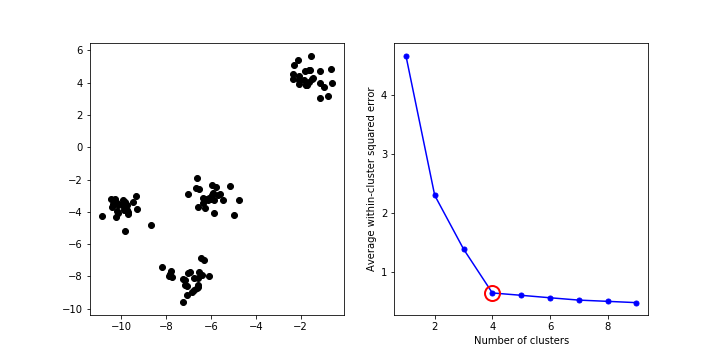
How to choose value of k?
- Elbow method
In [12]:
# Generate fake data
X, y = make_blobs(n_samples=100, n_features=2, centers=4, cluster_std=.6, random_state=1)

plt.figure(figsize=(10,5))
plt.subplot(1,2,1)
plt.scatter(X[:, 0], X[:, 1], c='k')

# Fit clusters for various numbers of clusters
from sklearn.cluster import KMeans
K = range(1,10)
KM = [KMeans(n_clusters=k, random_state=0).fit(X) for k in K]
centroids = [km.cluster_centers_ for km in KM]   # cluster centroids

# Compute average euclidean distance between each point and its cluster centroid
from scipy.spatial.distance import cdist
D_k = [cdist(X, cent, 'euclidean') for cent in centroids]
cIdx = [np.argmin(D,axis=1) for D in D_k]
dist = [np.min(D,axis=1) for D in D_k]
avgWithinSS = [sum(d)/X.shape[0] for d in dist]

plt.subplot(1,2,2)
kIdx = 3
plt.plot(K, avgWithinSS, 'b.-', ms=10)
plt.plot(K[kIdx], avgWithinSS[kIdx], marker='o', markersize=15, mew=2, mec='r', mfc='None')
plt.xlabel('Number of clusters')
plt.ylabel('Average within-cluster squared error')
plt.savefig('images/elbow.png')
plt.show()

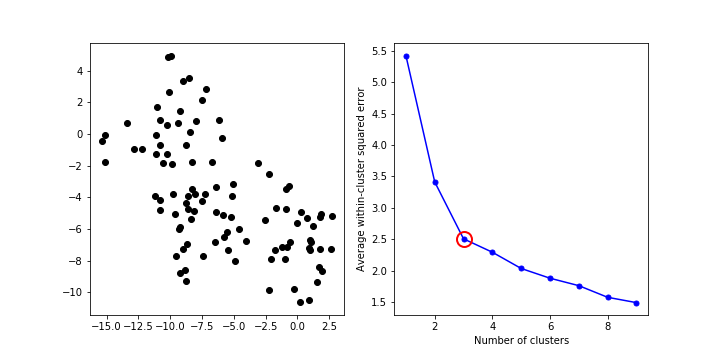
In [13]:
# Generate fake data
X, y = make_blobs(n_samples=100, n_features=2, centers=3, cluster_std=2, random_state=9)

plt.figure(figsize=(10,5))
plt.subplot(1,2,1)
plt.scatter(X[:, 0], X[:, 1], c='k')

# Fit clusters for various numbers of clusters
K = range(1,10)
KM = [KMeans(n_clusters=k, random_state=0).fit(X) for k in K]
centroids = [km.cluster_centers_ for km in KM]   # cluster centroids

# Compute average euclidean distance between each point and its cluster centroid
D_k = [cdist(X, cent, 'euclidean') for cent in centroids]
cIdx = [np.argmin(D,axis=1) for D in D_k]
dist = [np.min(D,axis=1) for D in D_k]
avgWithinSS = [sum(d)/X.shape[0] for d in dist]

plt.subplot(1,2,2)
kIdx = 2
plt.plot(K, avgWithinSS, 'b.-', ms=10)
plt.plot(K[kIdx], avgWithinSS[kIdx], marker='o', markersize=15, mew=2, mec='r', mfc='None')
plt.xlabel('Number of clusters')
plt.ylabel('Average within-cluster squared error')
plt.savefig('images/noelbow.png')
plt.show()

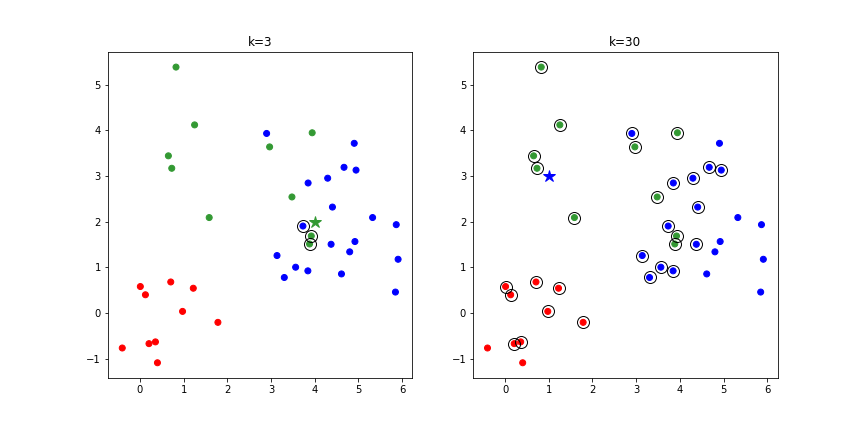
Results differ with random seed
In [14]:
X, y = make_blobs(n_samples=30, n_features=2, centers=3, cluster_std=2, random_state=0)
# Predict clusters using 2 different random seeds
from sklearn.cluster import KMeans
y_pred = KMeans(n_clusters=3, n_init=1, random_state=0).fit_predict(X)
y_pred2 = KMeans(n_clusters=3, n_init=1, random_state=1).fit_predict(X)

plt.figure(figsize=(12,4))
plt.subplot(1,3,1)
plt.scatter(X[:, 0], X[:, 1], c='k')
plt.subplot(1,3,2)
plt.scatter(X[:, 0], X[:, 1], c=y_pred)
plt.subplot(1,3,3)
plt.scatter(X[:, 0], X[:, 1], c=y_pred2)
plt.show()

Results differ with random seed
- But can run many iterations (random initializations)
In [15]:
X, y = make_blobs(n_samples=30, n_features=2, centers=3, cluster_std=2, random_state=0)
# Predict clusters using 2 different random seeds
y_pred = KMeans(n_clusters=3, n_init=100, random_state=0).fit_predict(X)
y_pred2 = KMeans(n_clusters=3, n_init=100, random_state=1).fit_predict(X)

plt.figure(figsize=(12,4))
plt.subplot(1,3,1)
plt.scatter(X[:, 0], X[:, 1], c='k')
plt.subplot(1,3,2)
plt.scatter(X[:, 0], X[:, 1], c=y_pred)
plt.subplot(1,3,3)
plt.scatter(X[:, 0], X[:, 1], c=y_pred2)
plt.show()

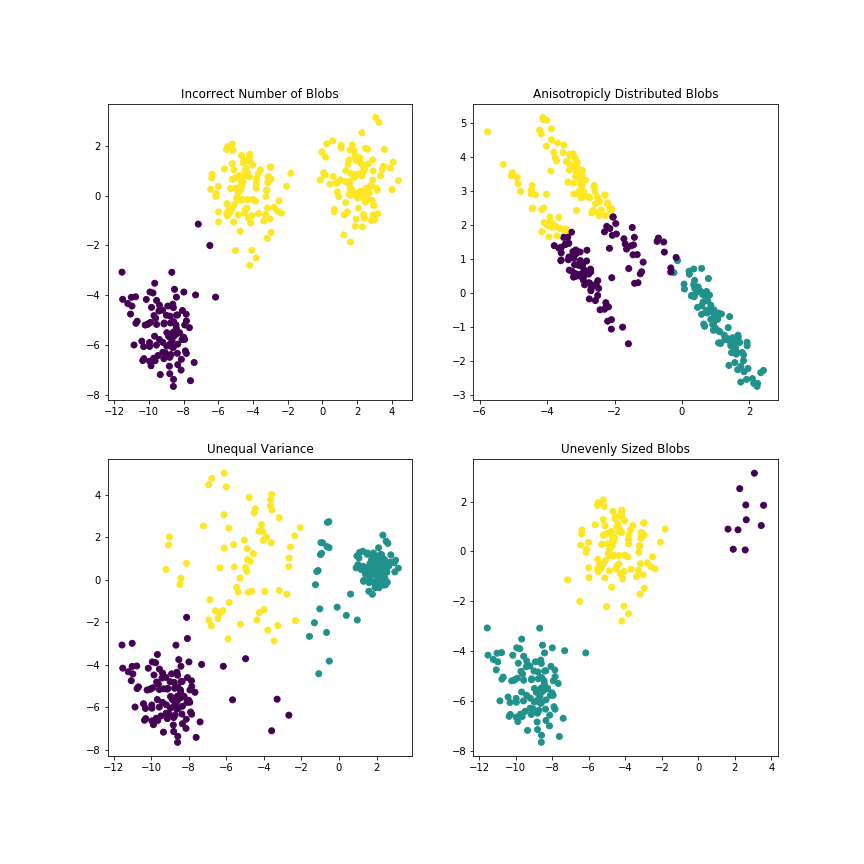
Limitations of k-Means
In [16]:
from sklearn.cluster import KMeans
from sklearn.datasets import make_blobs

plt.figure(figsize=(12, 12))

n_samples = 300
random_state = 170
X, y = make_blobs(n_samples=n_samples, random_state=random_state)

# Incorrect number of clusters
y_pred = KMeans(n_clusters=2, random_state=random_state).fit_predict(X)

plt.subplot(221)
plt.scatter(X[:, 0], X[:, 1], c=y_pred)
plt.title("Incorrect Number of Blobs")

# Anisotropicly distributed data
transformation = [[ 0.60834549, -0.63667341], [-0.40887718, 0.85253229]]
X_aniso = np.dot(X, transformation)
y_pred = KMeans(n_clusters=3, random_state=random_state).fit_predict(X_aniso)

plt.subplot(222)
plt.scatter(X_aniso[:, 0], X_aniso[:, 1], c=y_pred)
plt.title("Anisotropicly Distributed Blobs")

# Different variance
X_varied, y_varied = make_blobs(n_samples=n_samples,
                                cluster_std=[1.0, 2.5, 0.5],
                                random_state=random_state)
y_pred = KMeans(n_clusters=3, random_state=random_state).fit_predict(X_varied)

plt.subplot(223)
plt.scatter(X_varied[:, 0], X_varied[:, 1], c=y_pred)
plt.title("Unequal Variance")

# Unevenly sized blobs
X_filtered = np.vstack((X[y == 0][:500], X[y == 1][:100], X[y == 2][:10]))
y_pred = KMeans(n_clusters=3, random_state=random_state).fit_predict(X_filtered)

plt.subplot(224)
plt.scatter(X_filtered[:, 0], X_filtered[:, 1], c=y_pred)
plt.title("Unevenly Sized Blobs")
plt.savefig('images/limit.png')

plt.show()

Clustering accuracy
- Requires labels
- Compare different algorithms or hyperparameters
- Percentage of data points in the same cluster that share common label
K-means clustering
Advantages
- Simple, understandable
- items automatically assigned to clusters
Disadvantages
- Must pick number of clusters before hand
- Often terminates at a local optimum.
- All items forced into a cluster
- Too sensitive to outliers
Some other clustering options
- K-Medoids
- Move cluster to the centrally located point in each cluster
- $Median(S) = argmin_{x}(\sum_{s∈S}(|s-x|)$
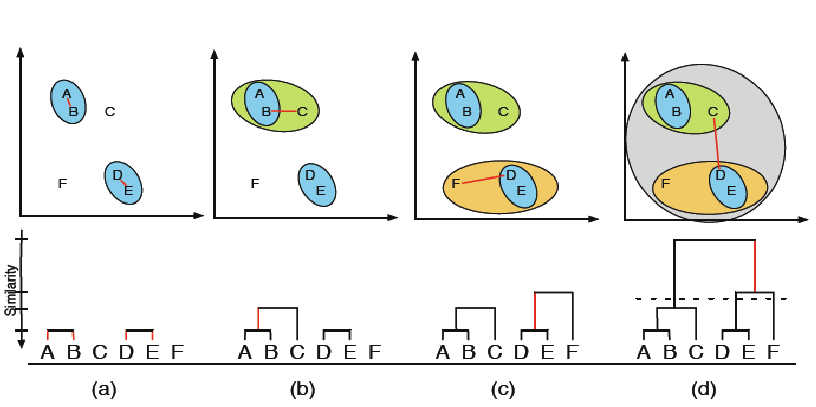
- Hierarchical clustering
In [ ]: